Loyalty dashboards drown brand teams in numbers. Member counts, transaction logs, point allocations, redemption rates, leaderboards, QR scan velocities, notification opens, approval queues, regional splits, category splits, and a dozen more variants of each.
What actually matters is a much shorter list: acquisition signals, engagement signals, and liability signals. Each tells the brand a different story about the program's health, and each demands a different operational response.
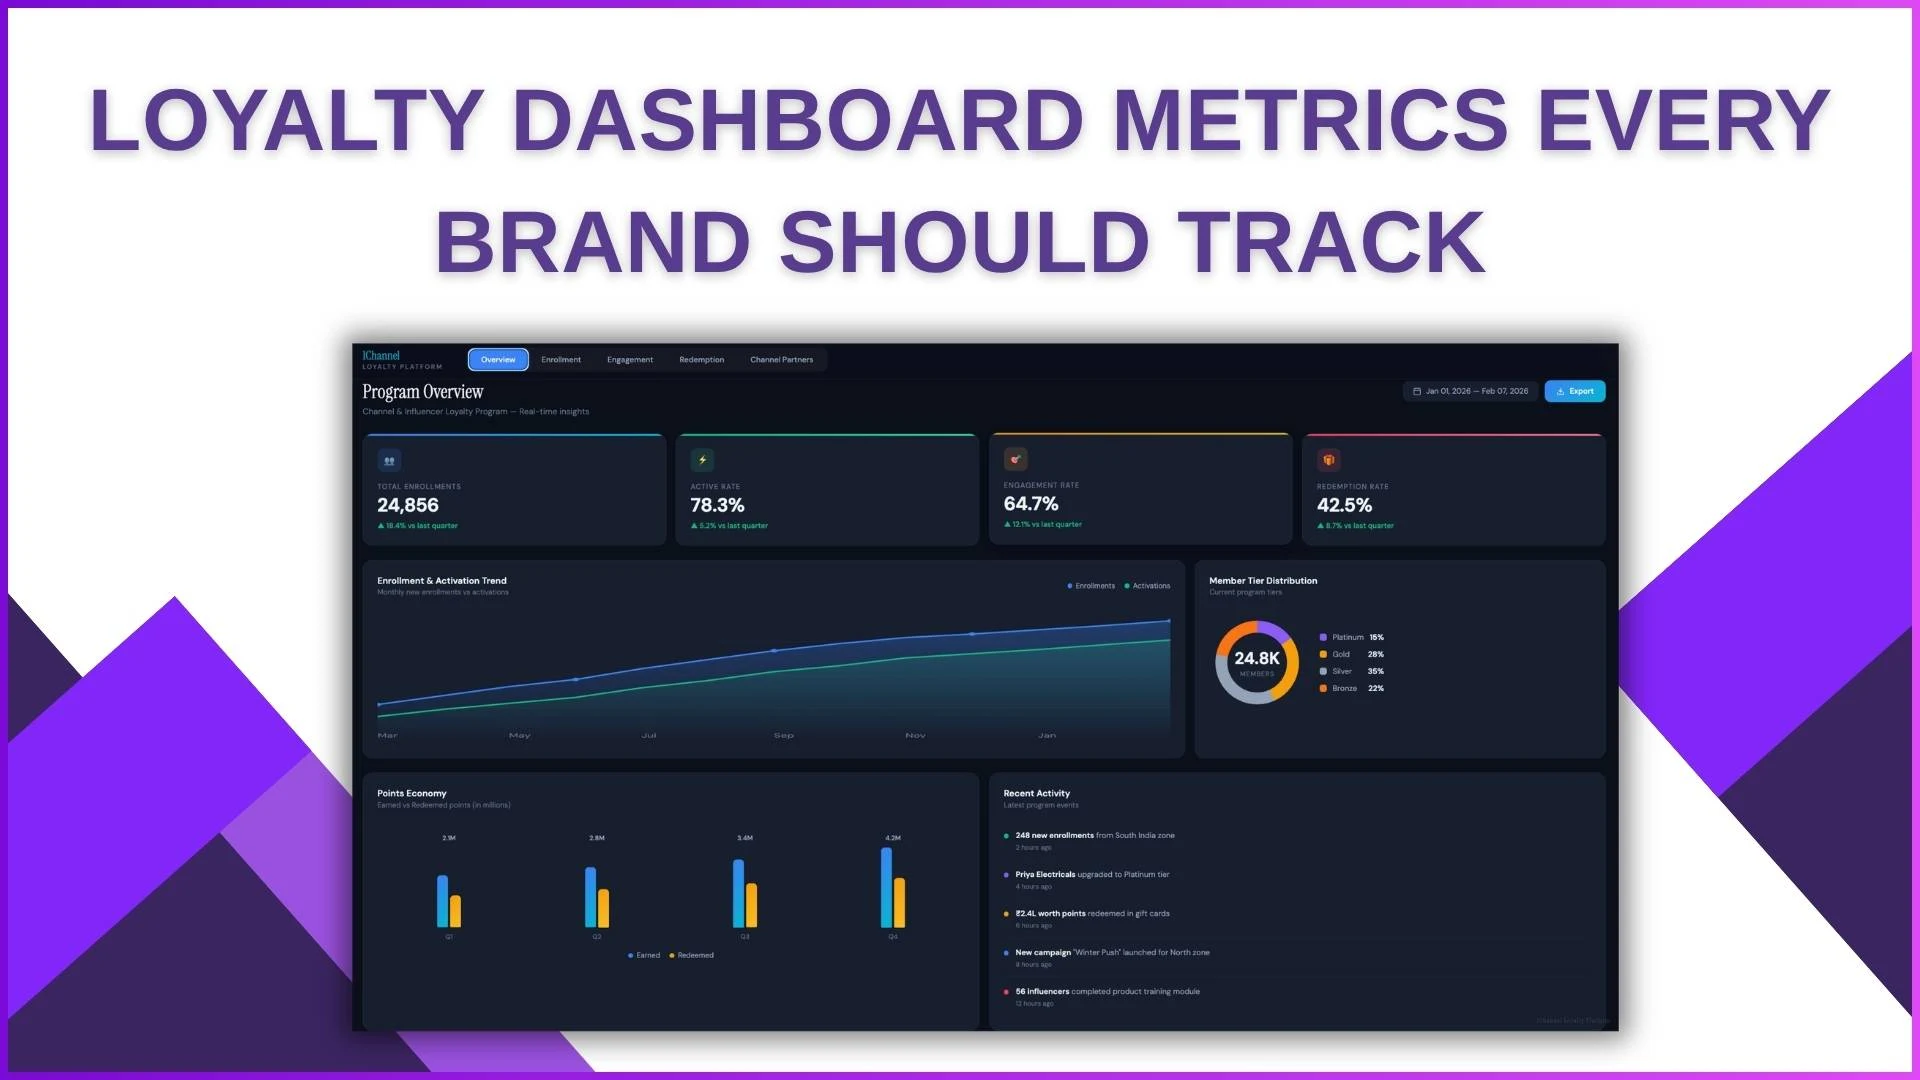
What follows are the six metrics that consistently drive operational decisions in Malaysian loyalty programs, grouped by what they tell the team and how they connect.
Table of Contents
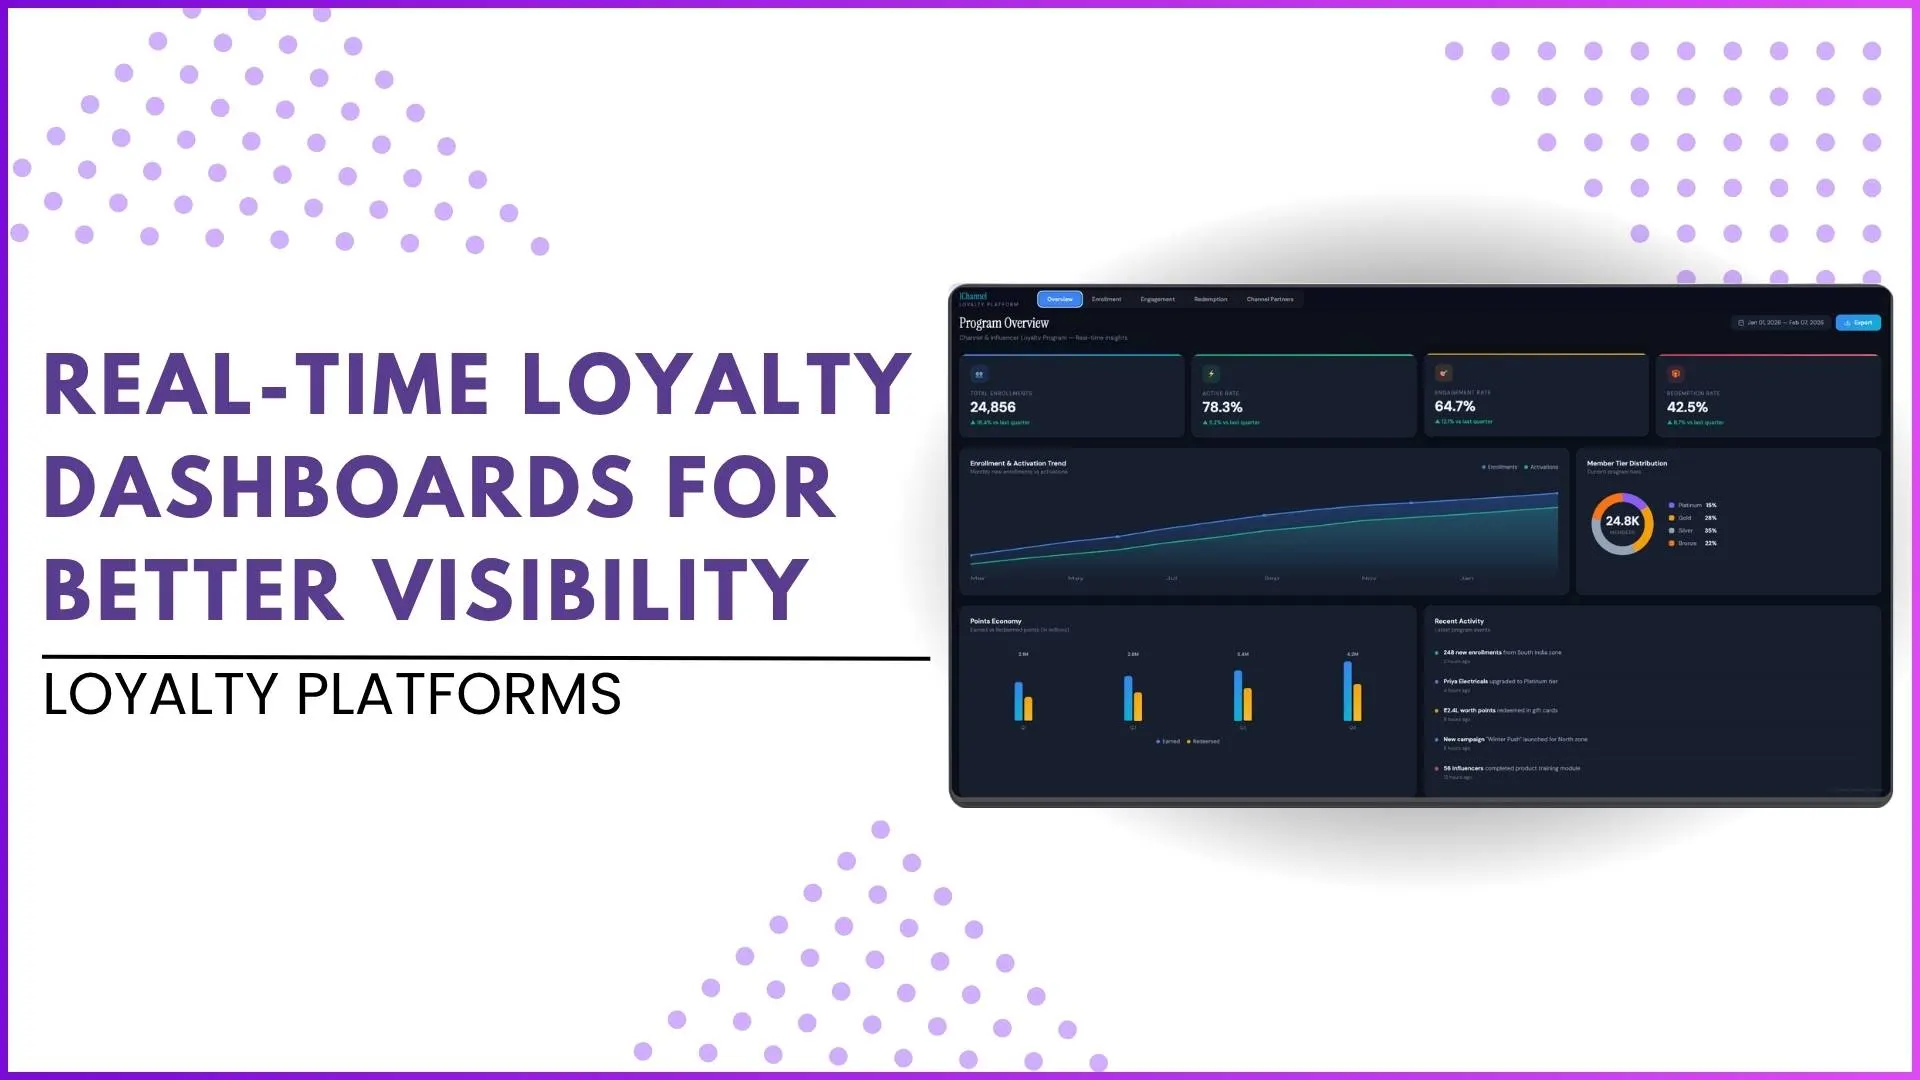
What "Loyalty Dashboard" Should Actually Show
A loyalty dashboard is not a feature list of the platform. It is the operational pulse the brand team reads every morning to decide where to push, where to pull back, and where to fix.
Good dashboards surface six to eight live numbers. Bad dashboards surface sixty and call it "comprehensive". The dashboard's job is decision support, not data archaeology.
Six Metrics That Map the Member Journey
Six metrics cover the bulk of what a Malaysian brand team needs, grouped into three categories:
Acquisition Metrics
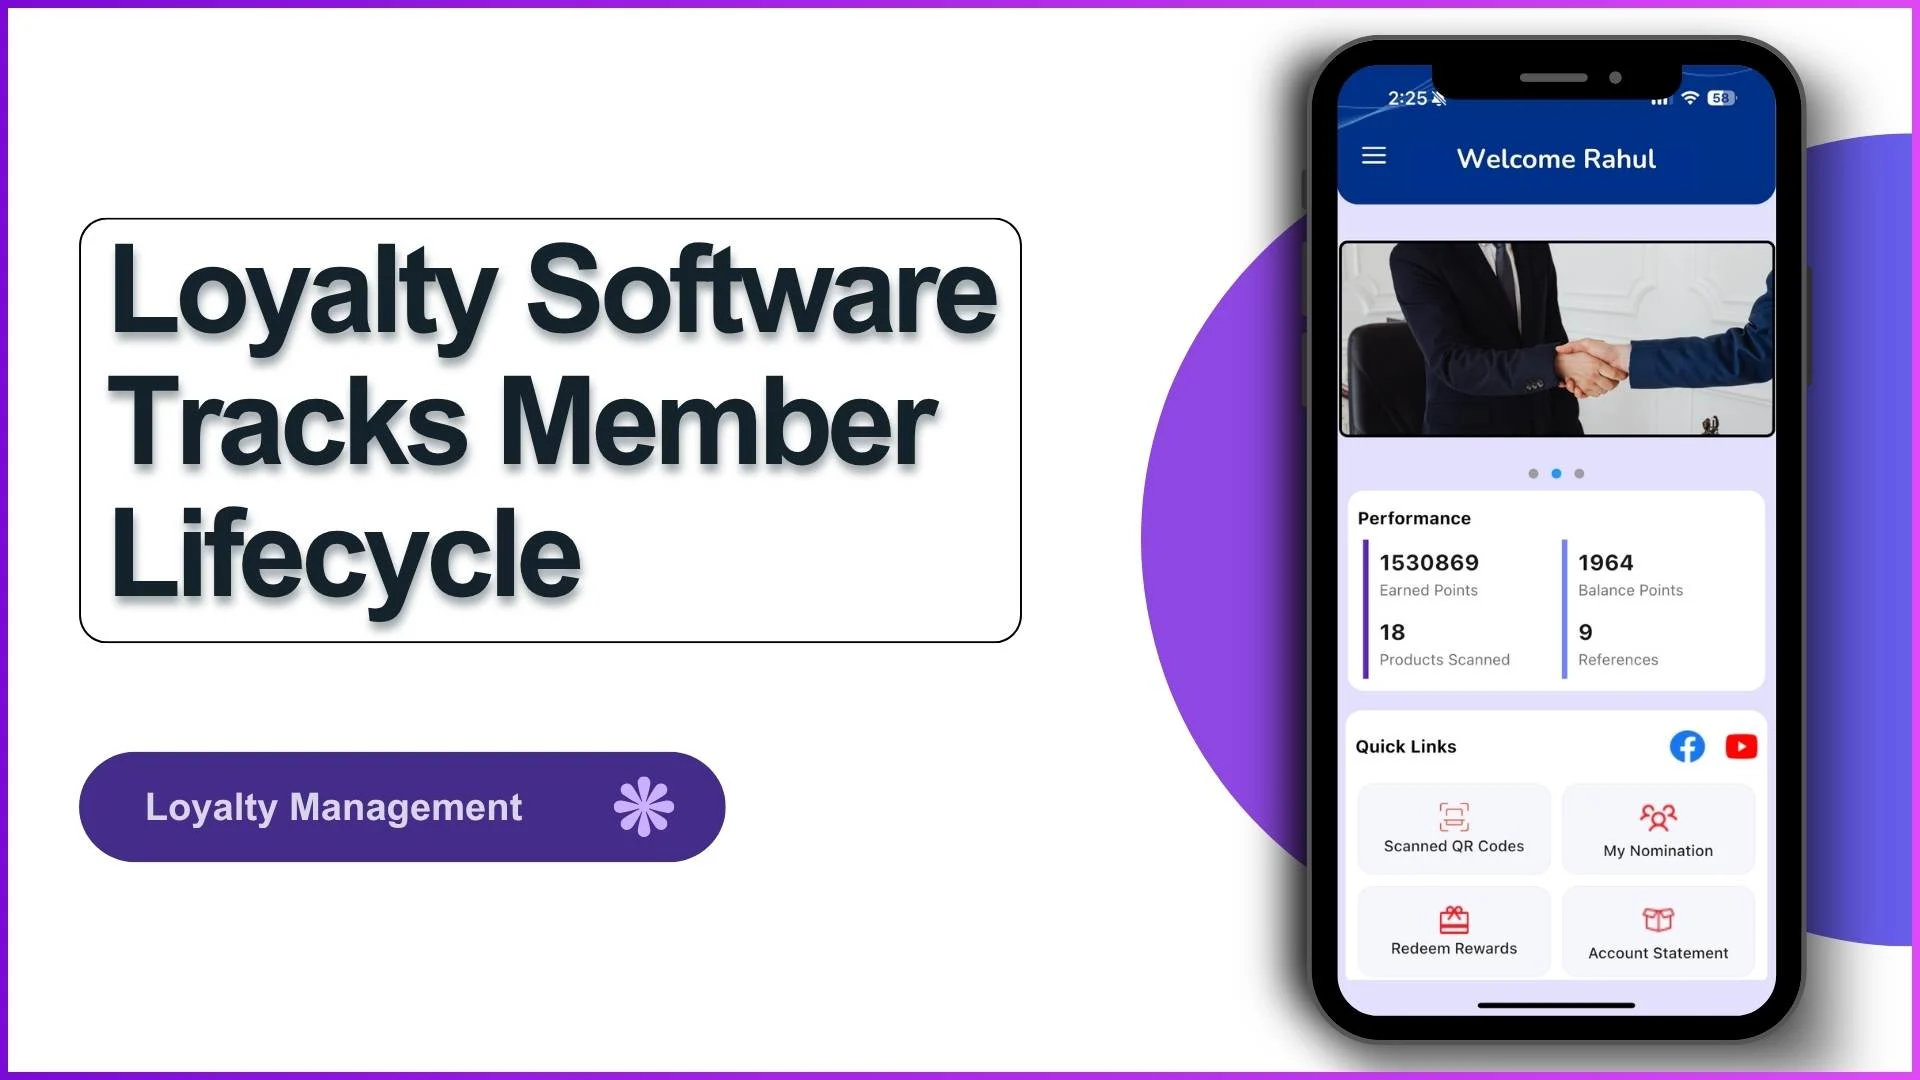
Member Growth
The count of new enrolments per period, broken down by source: QR scan, distributor referral, campaign code, organic. The slope tells the brand whether the funnel is working.
Active vs Inactive Ratio
Active members in the last 30 days as a share of total enrolled. The ratio signals whether enrolment is converting to engagement or stalling at the door.
Engagement Metrics
Transaction Velocity
Total transactions processed per period and average value per transaction. Reads the depth of program adoption beyond enrolment.
QR Scan Performance
Scan counts, fraud-flag rate, and scan-to-redemption gap. Surfaces operational issues before they affect the headline number.
Liability Metrics
Reward Liability
Points allocated minus points redeemed equals open liability. Finance reads this every month; the brand should read it daily.
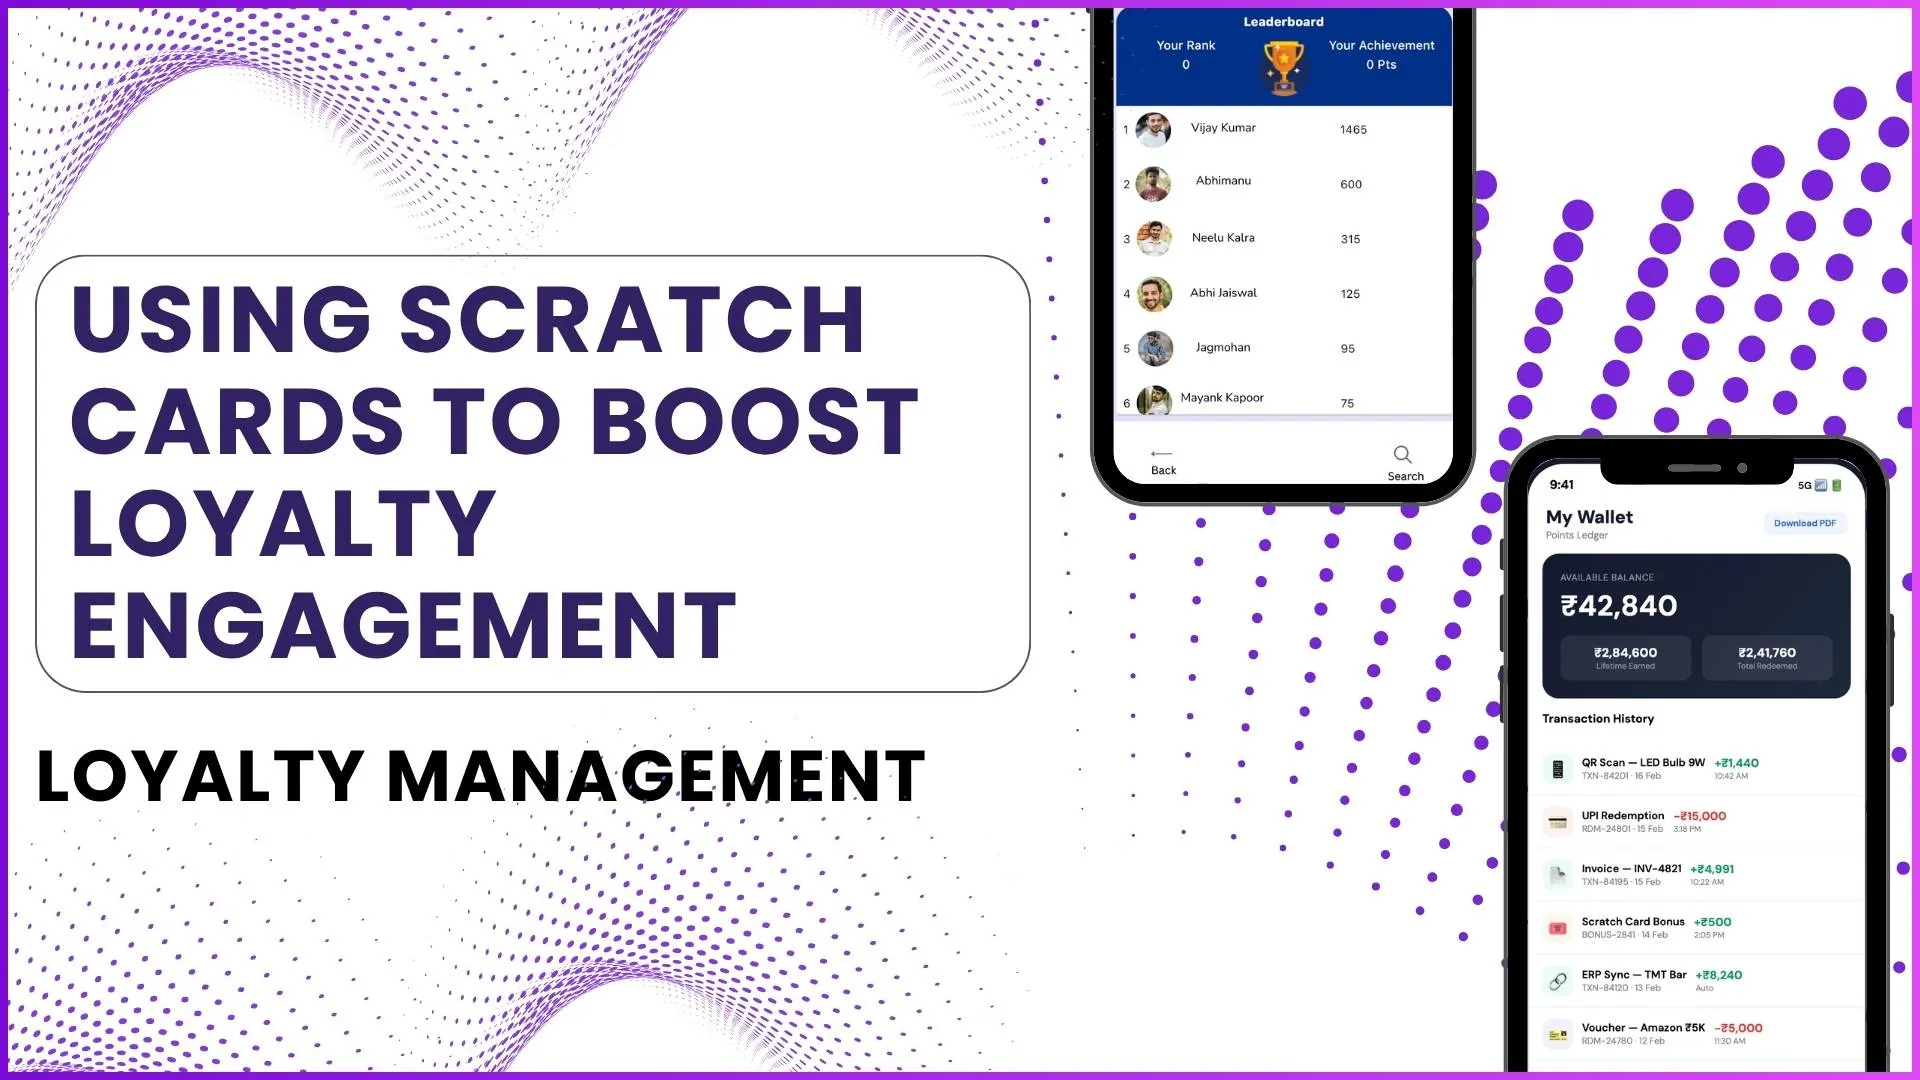
Redemption Performance
Redemption velocity per period and category mix of redemptions. Healthy programs see steady redemption that matches the brand's intended reward strategy.
How the Metrics Combine Into One Signal
Each metric tells one story. Combined, they tell a different one. A high acquisition rate with a low active ratio signals onboarding friction. High engagement with rising liability signals reward generosity beyond budget.
The dashboard's value is in the pairing, not the individual count. The platform surfaces the pairings automatically; the team reads the combined signal in five minutes.
How 1Channel Loyalty Surfaces These Metrics for Malaysian Programs
1Channel loyalty runs the dashboard through its cloud loyalty platform. Every event from enrolment through redemption posts to the same ledger the dashboard reads.
1Channel's AI engine watches the metrics for early divergence. Acquisition slipping in one region, liability rising faster than enrolment, or redemption shifting categories without a campaign trigger: all surface as soft alerts.
New dashboard widgets, metric thresholds, signal pairings, and alert recipients go live the same day they are approved, with an automated dry-run preview against the existing program base.
Explore Loyalty Program Software
1Channel's cloud loyalty platform surfaces every dashboard signal with AI-driven divergence detection and automated alert routing for Malaysian programs.
Explore Loyalty Program Software →Action Checklist for the First 30 Days
Five actions to land in the first month of running a metrics-driven loyalty dashboard:
- Lock the six core metrics. Resist the urge to add a seventh in week one. Six readings, all live, beat sixty readings, half of which lag.
- Define the alert pairings. Acquisition vs active ratio, engagement vs liability, redemption velocity vs reward budget. Build the pairings into the dashboard, not into a brand manager's head.
- Set the read cadence. Daily for the brand operations team, weekly for the regional managers, monthly for finance. One dashboard, three read rhythms.
- Wire the action triggers. Each metric crossing its threshold triggers a defined action: campaign push, alert review, supplier coordination. Triggers without actions are decorative.
- Review and prune at 30 days. Remove any metric the team did not act on. Add any signal the team kept asking for. Dashboards are operational, not architectural.