Field sales teams spend most of their time in the market visiting stores, interacting with retailers, executing merchandising tasks, and capturing sales data. However, simply tracking visits is not enough.
Businesses need clear productivity metrics to understand whether those visits are creating real impact.
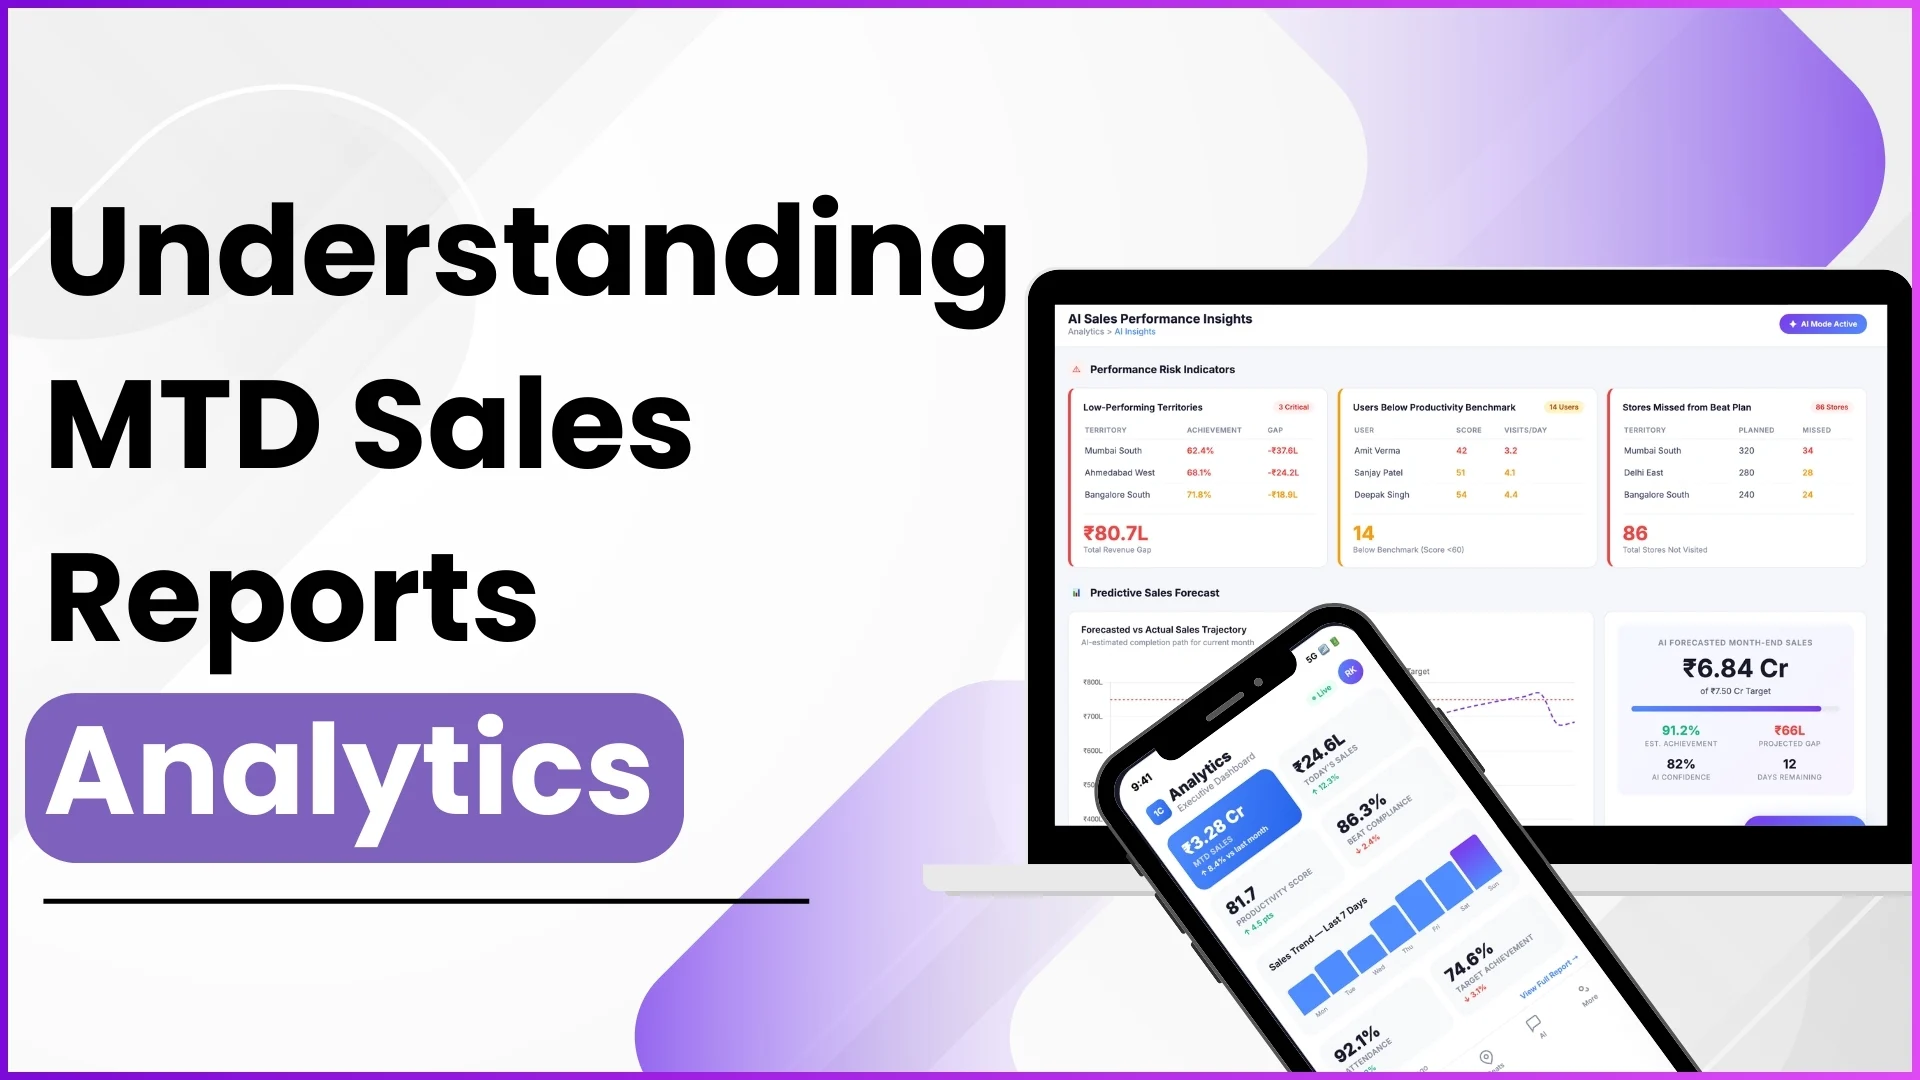
Modern sales automation platforms provide structured analytics and reporting that allow managers to evaluate how efficiently field teams perform during store visits. These insights help organizations improve planning, optimize routes, and increase sales productivity.
This blog explores the visit productivity metrics that matter most and how they help organizations measure and improve field performance.
Why Visit Productivity Metrics Are Important
Field teams operate across multiple stores, territories, and activities every day. Without measurable indicators, it becomes difficult to know:
- Whether planned stores are actually being visited
- How productive each visit is
- Whether sales and merchandising activities are completed properly
Analytics systems track daily store visits, activities performed, sales recorded, and compliance with beat plans, allowing managers to evaluate productivity in a structured way.
Example
A regional manager overseeing 20 field representatives may want to analyze:
- How many stores each rep visited today
- Whether they followed the assigned beat plan
- What activities they completed in each store
Instead of relying on manual reports, productivity analytics provides detailed visit data for every employee.
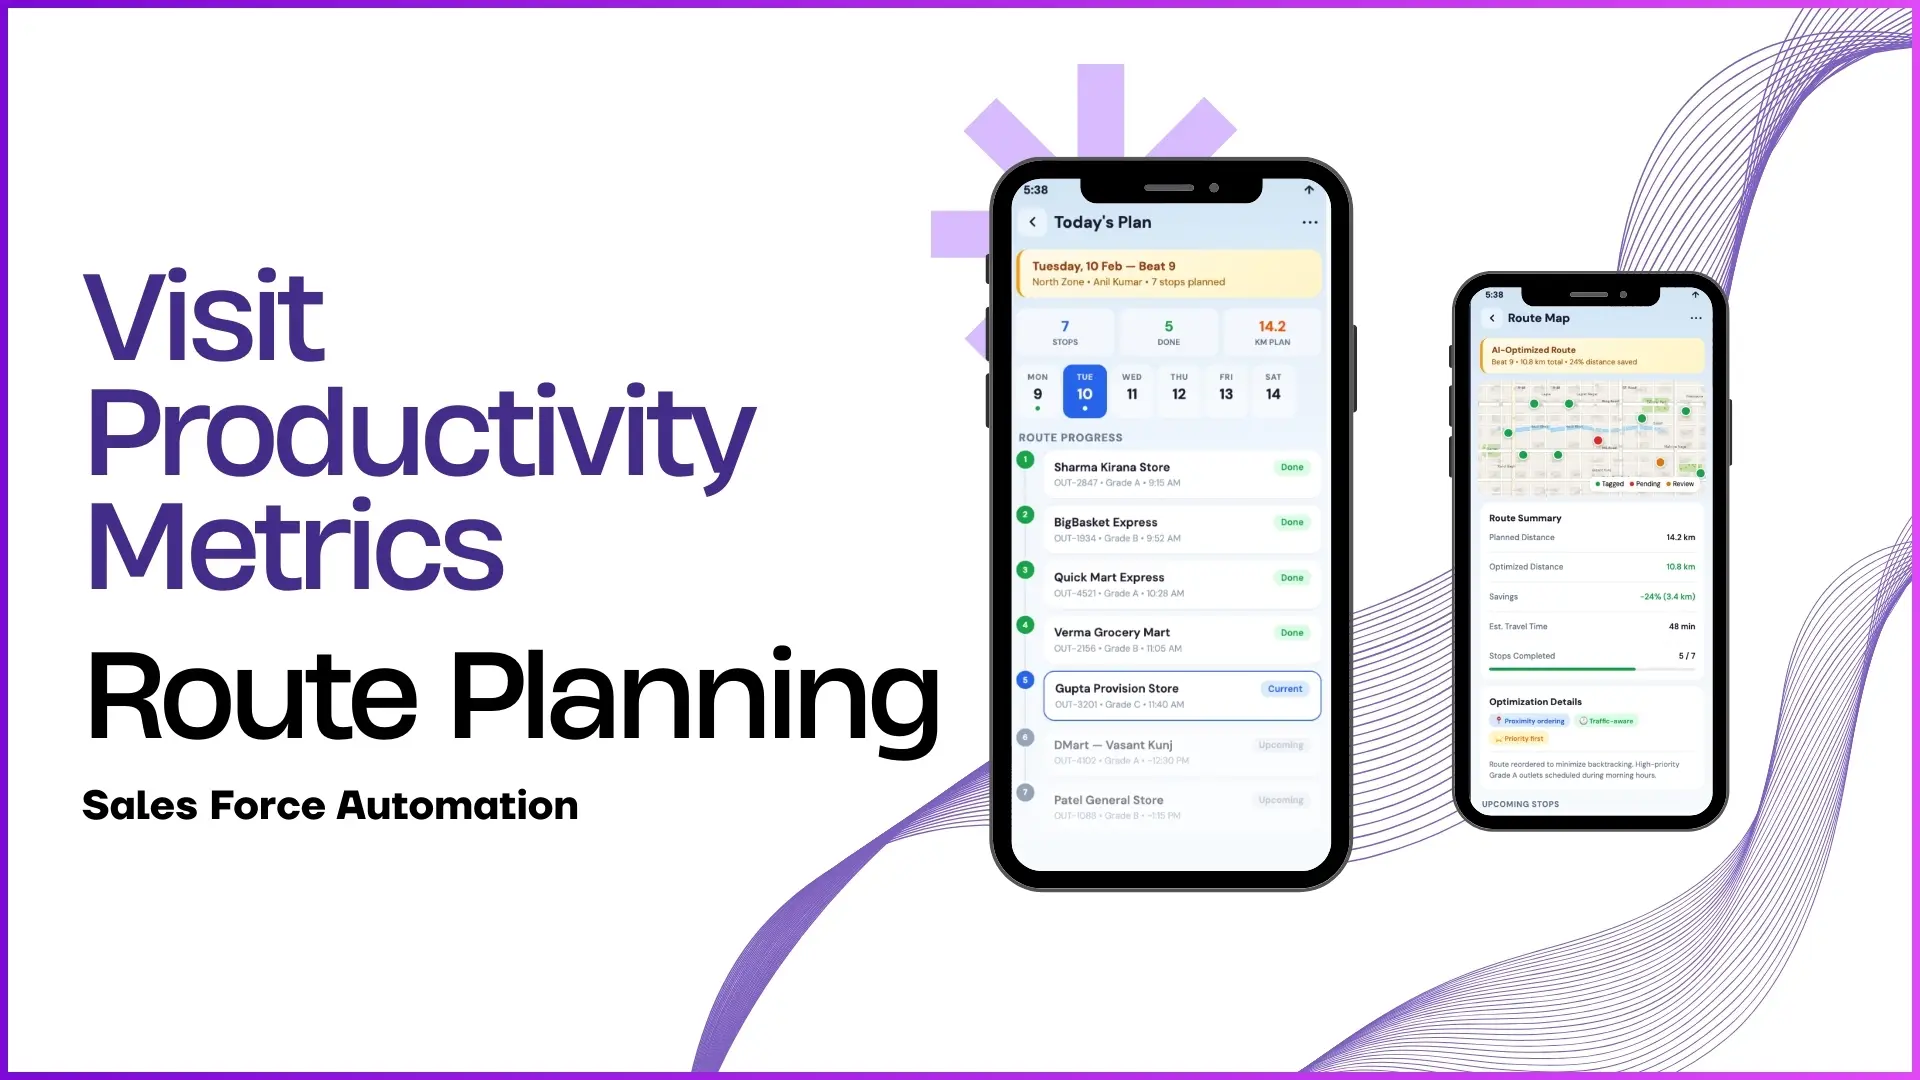
Optimize Route Planning with Smart Analytics
1Channel's Route Planning Software helps you track visit compliance, optimize field routes, and maximize daily productivity. Get real-time visibility into store visits and beat plan adherence.
Explore Route Planning Software →Key Visit Productivity Metrics to Track
1. Daily Store Visit Count
One of the most fundamental productivity indicators is the number of stores visited by a field employee in a given day. This metric helps managers determine whether the team is maintaining expected visit frequency.
A visit productivity report typically shows the daily count of stores visited by each field employee within a selected date range.
Example
A company expects each promoter to visit 10 retail stores per day.
Employee Planned Visits Actual Visits
Rahul 10 9
Meena 10 11
Arjun 10 6
From this report:
- Meena exceeded the target
- Rahul was slightly below target
- Arjun's performance requires review
Managers can then identify challenges such as travel time, route planning issues, or workload imbalance.
2. Beat Plan Compliance
Field visits usually follow a predefined beat plan, which specifies which stores must be visited on specific days.
Beat compliance measures how closely employees follow that schedule. It is calculated by comparing the number of stores covered in a day with the number of stores defined in the beat plan.
Example
A field representative's beat plan for Monday includes 8 stores.
Metric Value
Planned Stores 8
Visited Stores 6
Beat compliance = 6 ÷ 8 = 75%
If several employees show low compliance, it may indicate:
- Poor route planning
- Store accessibility issues
- Lack of adherence to the visit plan
Managers can adjust schedules or provide guidance to improve consistency.
3. Activity Completion Per Visit
Not all store visits are equal. The real value lies in what activities are performed during the visit.
A detailed visit productivity report can show what tasks were completed in each store, such as:
- Sales entry
- Stock updates
- Merchandising checks
- Product demonstrations
- Questionnaire responses
Example
During a visit to Store A, a promoter may perform the following activities:
Activity Status
Sales update Completed
Merchandising check Completed
POSM photo upload Completed
Retail survey Not completed
Managers can see whether visits are transactional or truly productive.
4. Sales Productivity by Store
Sales productivity is another important metric tied directly to visits. Reports can show SKU-wise sales for each store along with average daily productivity.
This helps businesses understand which stores generate revenue and where additional effort is needed.
Example
Store Units Sold Daily Average
Store A 40 High productivity
Store B 15 Moderate productivity
Store C 3 Low productivity
If a store receives frequent visits but generates low sales, managers may need to review pricing, availability, or promotional strategy.
5. Sales Productivity by Value
Another version of the productivity metric focuses on sales value instead of units sold.
This report shows SKU-wise sales value per store, helping organizations understand revenue contribution.
Example
Store Sales Value (₹)
Store A ₹45,000
Store B ₹18,000
Store C ₹6,000
Even if the number of units sold is small, high-value products can make a store highly productive.
6. Distance and Movement Analysis
Understanding how employees move between stores can reveal efficiency gaps. Activity reports may include:
- Distance travelled during the day
- Distance between store visits
- First and last transaction times
These insights help managers identify whether the team is spending time effectively in the field.
Example
If a representative travels 60 km but visits only 4 stores, the issue may lie in route planning or territory distribution.
By adjusting the store allocation, the company can increase daily productivity.
7. Visit-Level Activity Reports
A comprehensive store visit report can provide a full picture of each visit, including:
- Store details
- Activities performed
- Sales recorded
- Photos uploaded
- Location data
This allows supervisors to review every individual visit in detail.
Example
A store visit report might show:
- Check-in time: 11:10 AM
- Check-out time: 11:25 AM
- Activities: Sales entry, merchandising photo
- Store location: GPS verified
Such detailed reporting helps ensure accountability and operational transparency.
8. Market Visit Plan Tracking
Market visit plans define which stores employees should visit during a certain period. Productivity metrics compare planned visits with actual visits.
Managers can generate reports showing visit plans for a specific date range.
Example
Employee Planned Stores Completed
Rohit 12 12
Kavita 10 7
This comparison helps organizations evaluate planning effectiveness and team discipline.
Using Visit Productivity Insights for Better Decisions
Tracking productivity metrics is only valuable when organizations use the insights to improve operations.
These insights help managers:
- Optimize store routes
- Balance workloads among employees
- Identify high-performing territories
- Improve field accountability
- Increase sales conversion during visits
By combining visit analytics with sales and activity reports, companies gain a complete view of field operations.
How 1Channel SFA Helps Track Visit Productivity?
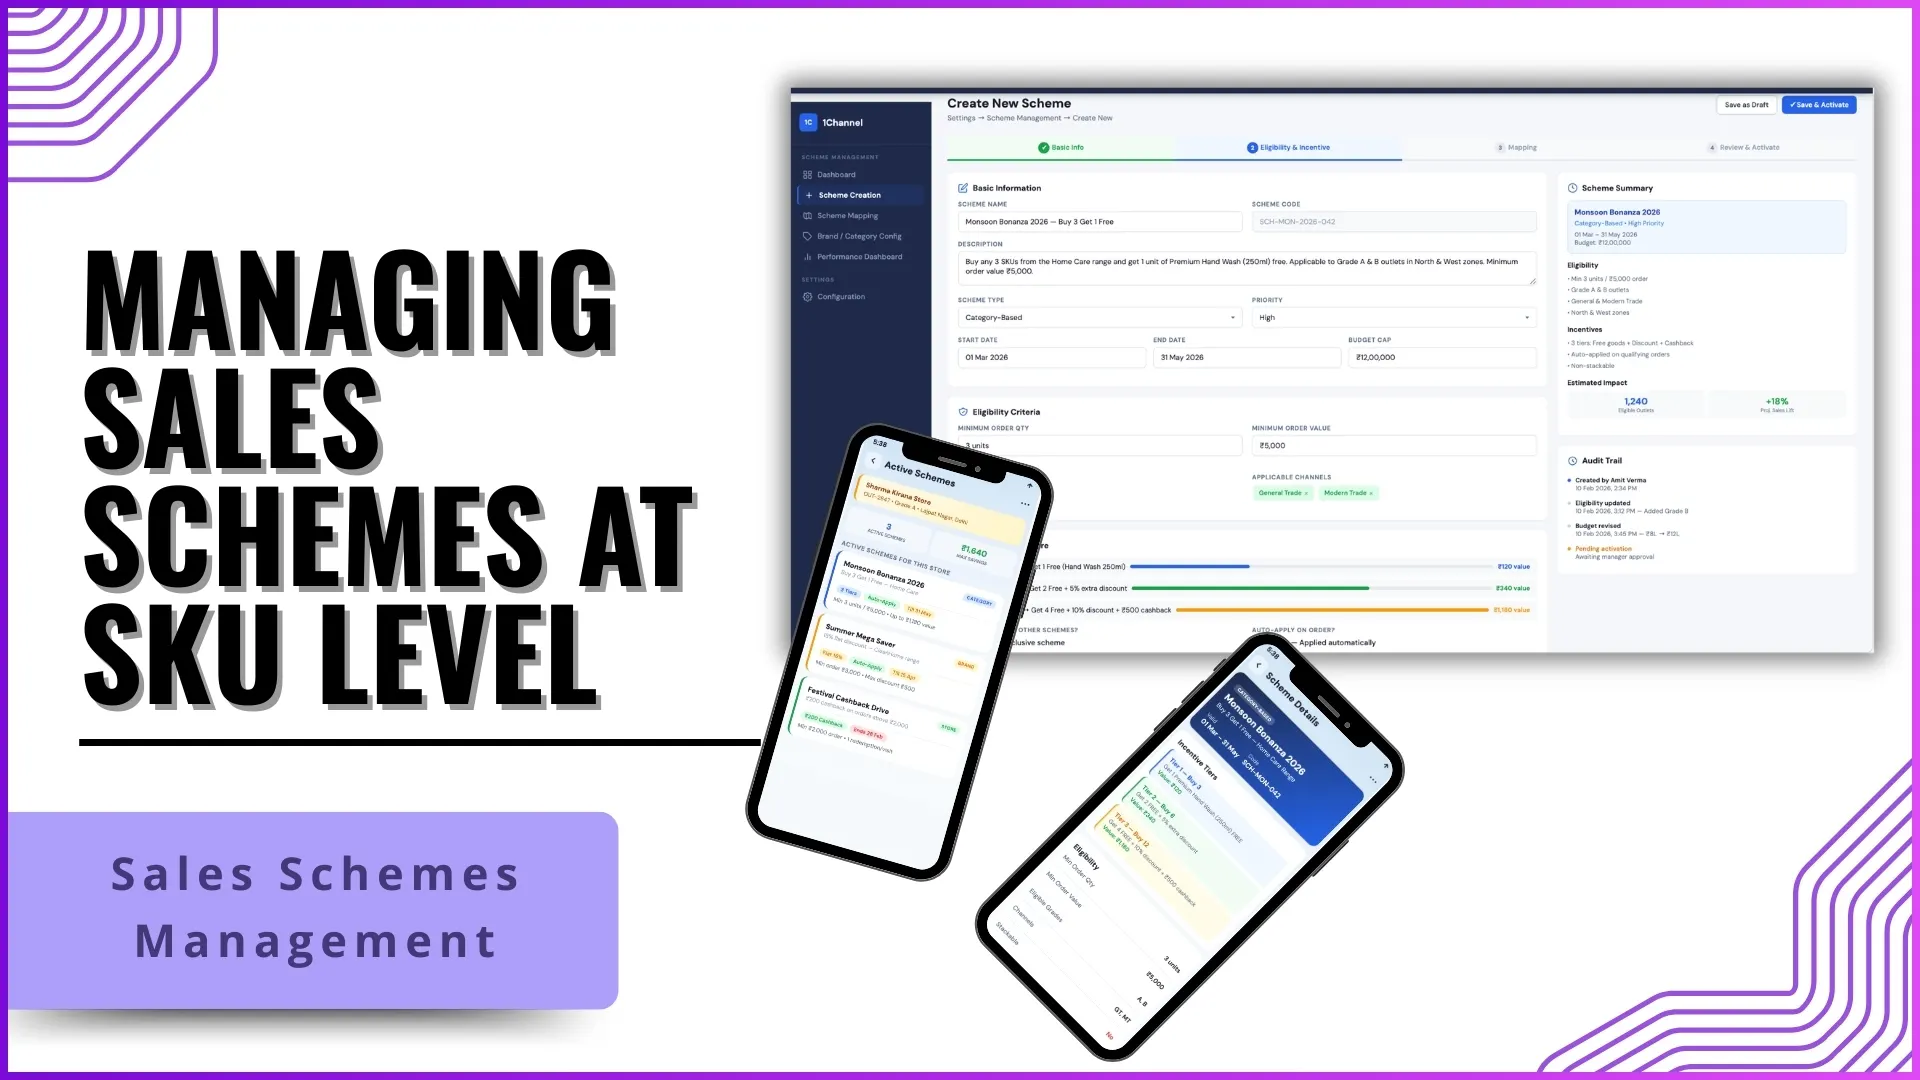
Solutions like 1Channel SFA provide an integrated platform where businesses can track field activities, generate productivity reports, and monitor market performance from a single portal.
Through its analytics and reporting capabilities, managers can access multiple productivity insights such as:
- Visit productivity reports showing daily store visits
- Detailed reports highlighting activities completed in each store
- Sales productivity reports by unit and value
- Beat compliance reports for route adherence
- Movement analysis including distance travelled and transaction times
These capabilities allow organizations to monitor field teams in real time and ensure that market visits translate into measurable business outcomes.
Transform Field Sales with Smart Automation
1Channel's Sales Force Automation platform delivers comprehensive visit tracking, productivity analytics, and beat plan management. Monitor field performance, optimize routes, and drive sales efficiency.
Explore Sales Force Automation →Conclusion
Visit productivity is one of the most critical indicators of field sales performance. Tracking simple metrics like store visits is not enough organizations must analyse what happens during each visit, how closely teams follow their plans, and how those visits translate into sales results.
By focusing on the right productivity metrics such as visit counts, beat compliance, activity completion, and sales productivity businesses can gain deeper visibility into field operations.
With structured analytics and detailed visit reporting, organizations can turn everyday store visits into data-driven opportunities for growth, efficiency, and better decision-making.