Across most Malaysian operations, sales reporting still falls into one of three buckets at month-end: how many SKUs moved, how many units shifted, and how much value the territory generated.
Each measure tells a different story. SKU breadth tells the brand which products reached the shelf. Unit volume tells operations which lines are scaling. Value contribution tells finance which categories are paying the rent.
What AI changes is not the measure itself. It changes the speed at which each one updates, the granularity the manager can drill into, and the speed at which a deviation becomes an action.
Table of Contents
What "SKU, Unit, and Value Sales Tracking" Actually Covers
SKU tracking counts which products moved in the period. A 1000-SKU portfolio is healthy if 700 SKUs move every month and concerning if only 300 do, even when the value number stays the same.
Unit tracking measures volume: pieces, cases, bottles. Productivity per rep and per outlet read against unit counts.
Value tracking measures revenue contribution. Two SKUs with identical unit volumes can differ tenfold in value depending on the price tier.
Where AI Changes the Tracking Loop
Comparing manual sales tracking to the AI-augmented loop, six steps shift:
| Step | Manual Tracking | AI-Augmented Tracking |
|---|---|---|
| Data refresh | Monthly close-of-books | Continuous as visits log |
| SKU coverage | Top 20 SKUs reviewed | Every SKU on the master |
| Anomaly surface | Spotted in month-end review | Flagged within hours |
| Granularity | Brand to category | Rep to outlet to SKU |
| Forecast | Last-quarter average | Velocity-adjusted model |
| Action trigger | Manager flags after report | Alert fires before report |
What Reports Sit at the Core
Six reports cover most of what an AI-driven sales tracking stack delivers: MTD tertiary sales (rep to retail), MTD secondary sales (distributor to retail), category-level MTD breakdown, productivity by unit, productivity by value, and the detailed transactional log.
Each report inherits from the same underlying data and refreshes at the same cadence. The AI engine surfaces the anomaly worth attention; the report carries the proof.
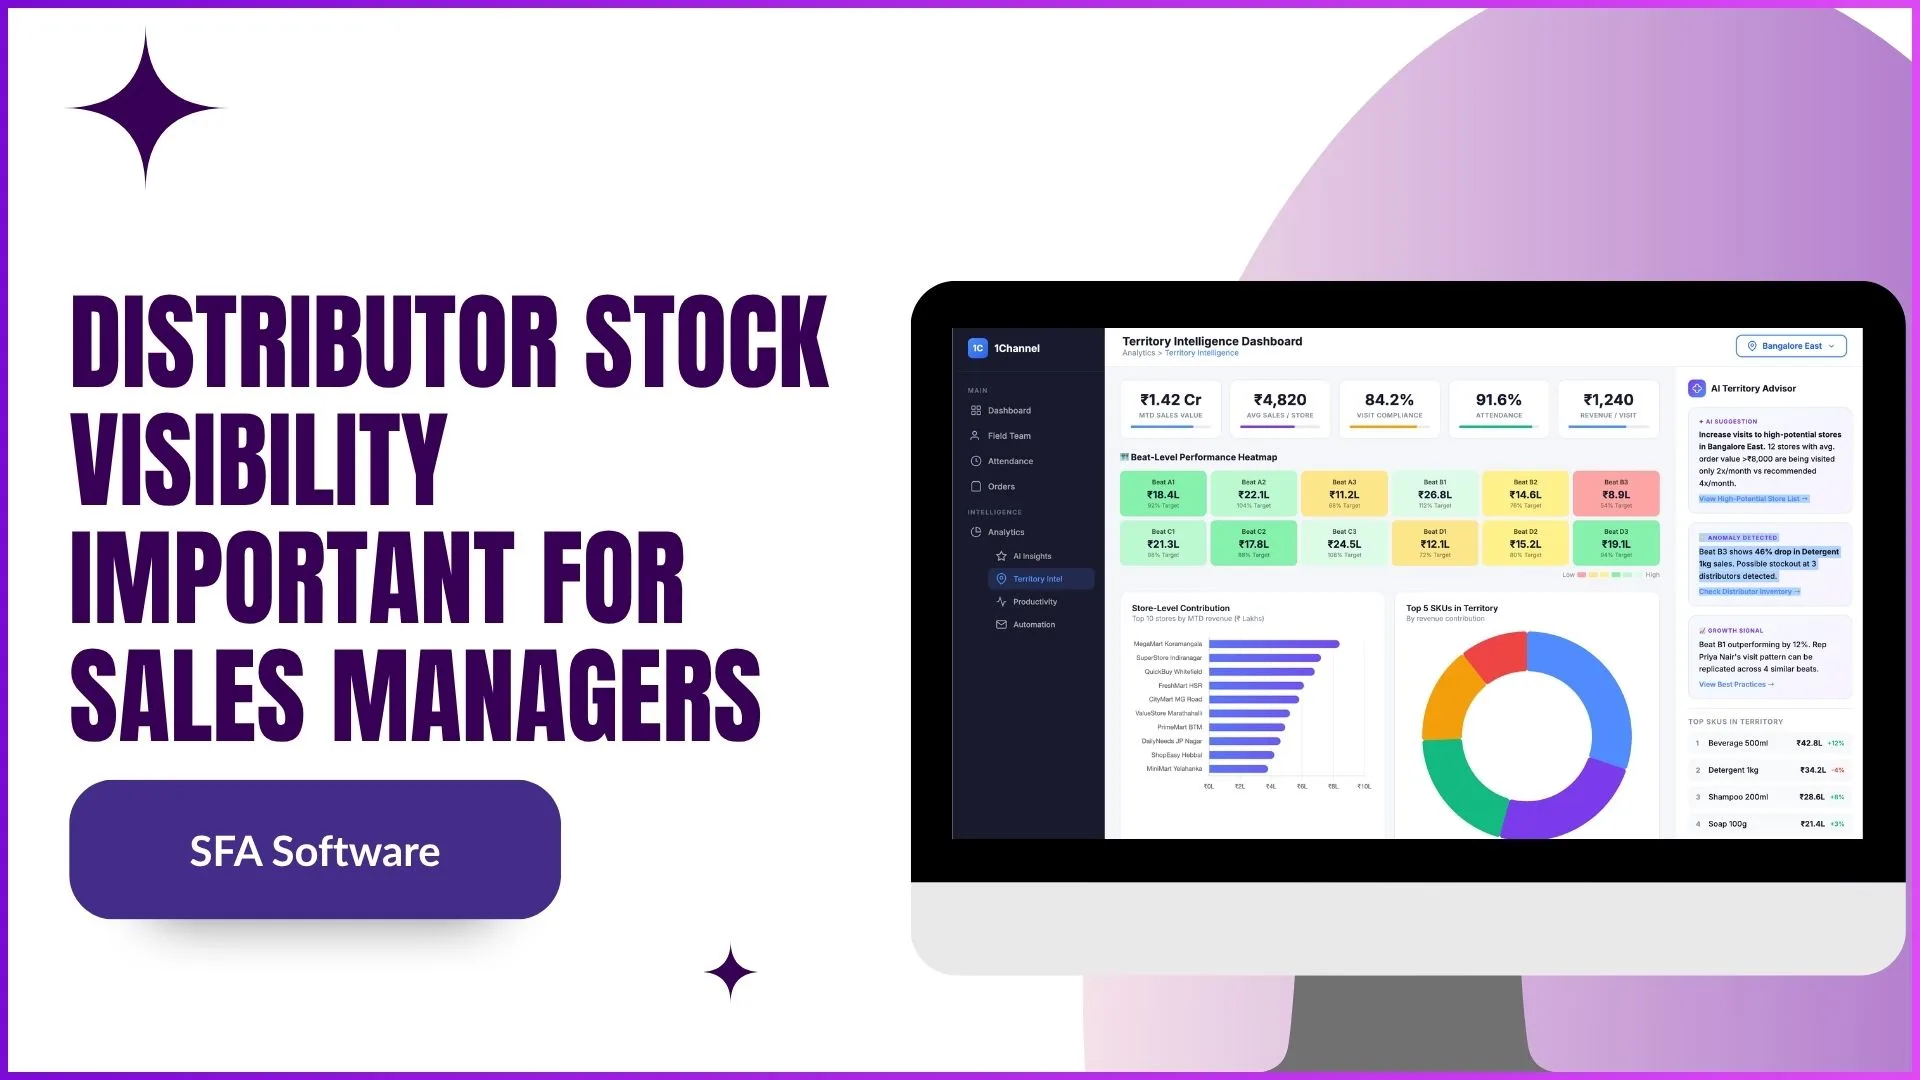
How AI Connects Sales Tracking to Stock Visibility
Sales tracking without stock visibility tells half the story. A flat SKU velocity might mean weak demand or it might mean the SKU was out of stock all month.
The AI engine joins the sales feed and the stock feed automatically. A flat number with stock present is a demand issue; a flat number with stockout is a supply issue. The action sequence differs.
Where Field Teams Read the Signal
Reps read SKU velocity for the outlets in their beat. Supervisors read productivity for their reps. Regional managers read value contribution for the territory.
Each level sees the slice that drives the next conversation. The platform does not push everyone the same dashboard; it pushes each role the data that matches the role's action authority.
How 1Channel Embeds AI in Sales Tracking for Malaysian Brands
1Channel runs SKU, unit, and value sales tracking through its cloud SFA and analytics suite. Every visit, order, and stock event posts to the same ledger the reports read.
1Channel's AI engine reads the velocity patterns continuously. A SKU whose volume has been slipping across one chain, a region where value contribution is widening below baseline, or a rep whose productive call ratio is dropping: all surface as soft alerts.
New report templates, alert thresholds, model boundaries, and review cadences go live the same day they are approved, with an automated dry-run preview against existing production data.
Explore Sales Force Automation
1Channel's cloud SFA platform tightens SKU, unit, and value sales tracking with AI-driven velocity anomaly detection for Malaysian brands.
Explore Sales Force Automation →Choosing the Right Reporting Model
Four reporting models cover most Malaysian operations. Pick by what the operations team needs to act on:
SKU-First Reporting
Best for portfolios with wide product mix where shelf-presence is the leading metric. Tracks coverage breadth before depth, useful when the brand cares about reaching every SKU slot in every store.
Unit-First Reporting
Best for high-volume categories where unit movement drives the conversation: FMCG staples, beverages, daily-use SKUs. Productivity reads cleanly when the unit count is the primary number.
Value-First Reporting
Best when premium-tier SKUs carry the revenue. The manager reads value contribution per SKU and per territory, with unit volume sitting as the secondary measure.
Combined Index Reporting
Best for mature operations that need one score across SKU, unit, and value. Weights tune to the brand's strategy: heavy on breadth, depth, or revenue depending on the quarter's priority.