Beat compliance is the single number that tells a Malaysian sales manager how much of yesterday's planned coverage actually happened. If the beat plan said the promoter should visit twelve outlets and only nine got checked in at, beat compliance is 75%. The number sounds simple, but it is the only signal that ties planning, execution, and accountability together in one daily metric, and it is what makes the difference between managing a field team and just budgeting one.
Table of Contents
How Beat Compliance Is Calculated
The platform compares the day's beat plan against the actual visit log. Outlets the rep checked in at are counted as covered. Outlets in the plan that the rep did not reach are missed. The compliance percentage rolls up across the day, week, and month, with the same calculation applied at every level of the team. A promoter sees their own number, an Area Manager sees the cluster average, and the country head sees the company-wide trend.
Where Managers Read the Number
Beat compliance surfaces in two views inside the SFA portal. The Advanced Dashboard places the live number on the manager's home screen, with team-level filters for region, area, and individual rep. Drilling in opens the Beat Compliance Report under analytics: this is where the day-by-day breakdown sits, with planned versus actual visits per outlet, and the missed-visit reason where the rep submitted one.
Three supporting reports add context to the headline number:
- The Visit Productivity Report counts how many outlets each rep covered per day, regardless of whether they were planned.
- The Detailed Visit Productivity Report layers in the activities done at each visit, separating low-effort check-ins from real work.
- The Market Visit Plan Report holds the planned beat data the compliance percentage is calculated against.
How 1Channel Connects Planning, Execution, and Compliance
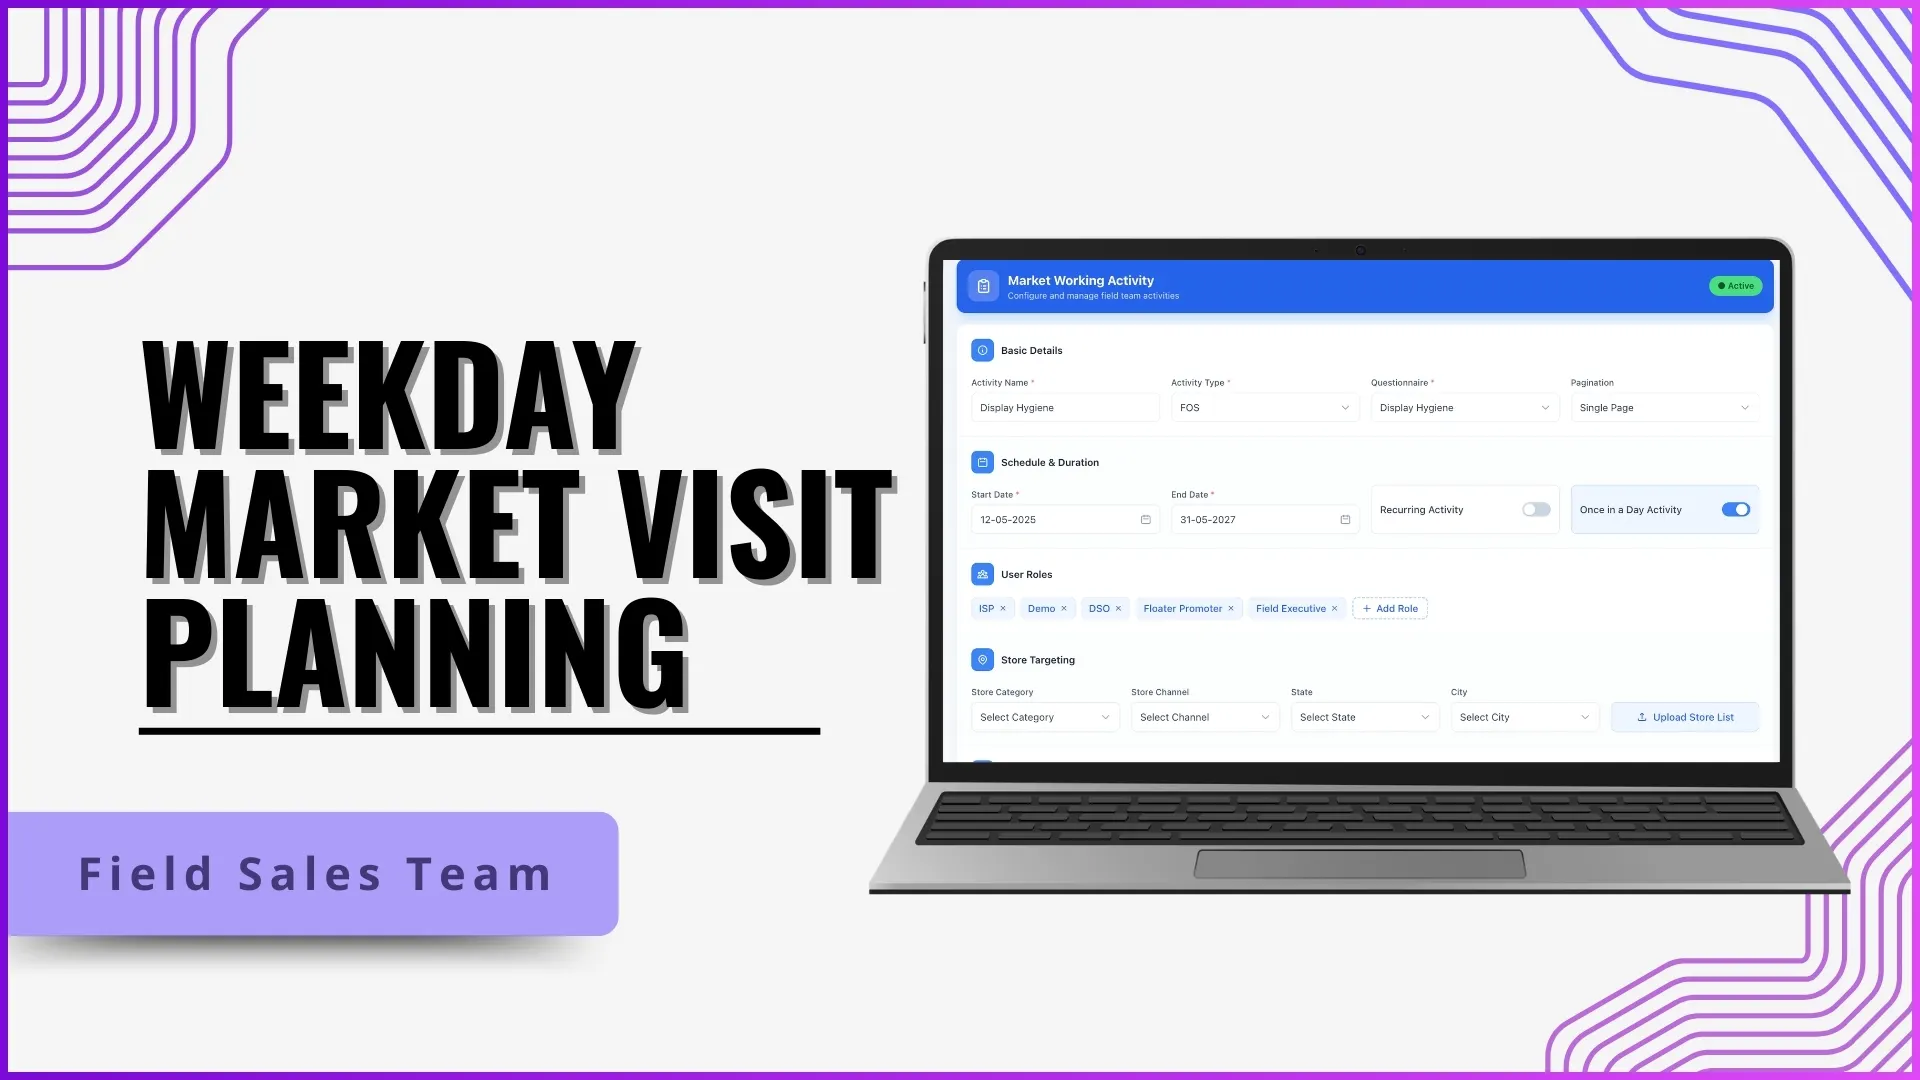
1Channel handles beat compliance as a connected loop across three modules. The Beat Plan Approval flow keeps the plan honest at the start: the Area Manager approves the upload before it goes live, so the compliance percentage measures against a baseline both sides agreed on. Market Visit Plan and Weekday Market Visit Plan handle the daily and recurring beats. The Attendance module aligns rep presence with beat data, so the manager can spot whether a low compliance number is a coverage issue or an attendance one. On the analytics side, 1Channel's Report Builder lets the team configure a custom compliance view if the default report does not fit the operation.
Explore Route Planning Software
1Channel's cloud route planning module lets Malaysian sales managers build beats, track day-of-week compliance, and act on coverage gaps the same week they appear.
Explore Route Planning →What This Looks Like in Practice
An Area Manager opens the 1Channel dashboard on Monday morning and sees the team-wide beat compliance at 68% for the previous week. Drilling in, three reps account for most of the gap. One missed Friday's beats entirely, and the Attendance Report shows they were on approved leave. Another covered fewer outlets than planned, and the Detailed Visit Productivity Report shows they spent too long at the first three stops. The manager has the conversations the same week, the routes are rebalanced for the rep running long, and the next week's compliance lands at 84%.