It is 9:20 AM on a Monday. A regional sales manager in Kuala Lumpur oversees 45 field representatives spread across Selangor, Perak, and Negeri Sembilan. She needs to know one thing before her 10 AM operations call: how many of her team members are actually in the field right now?
Without a centralised attendance dashboard, answering this question involves calling team leaders, scrolling through WhatsApp group messages, or waiting until end-of-day reports arrive. By then, the information is already stale. A rep who did not show up in Ipoh this morning has already missed half a day of outlet visits, and the manager only finds out at 6 PM.
A real-time attendance dashboard inside SFA software eliminates this blind spot entirely. It gives managers a single screen that answers who is in the field, who is late, who has not reported, and how attendance patterns are trending over time, all updated the moment a rep marks attendance from their mobile app.
Table of Contents
The Problem: Attendance Data That Arrives Too Late
Field sales attendance is fundamentally different from office attendance. There is no turnstile, no biometric scanner at the door, no receptionist watching who walks in. A rep's workday starts when they reach their first outlet, which could be in Johor Bahru, George Town, or a rural town in Sabah. The locations change daily based on beat plans.
Most organisations that lack an attendance dashboard rely on one of these methods:
- WhatsApp check-ins. Reps send a "Good morning, starting market" message to their group. Managers manually scan through 30 to 50 messages to figure out who reported and who did not. Messages get buried, and nobody tracks timing.
- End-of-day Excel reports. Team leaders compile attendance manually at the end of each day and email it to regional managers. By the time the report arrives, corrective action is impossible.
- Monthly payroll reconciliation. Attendance discrepancies surface only when payroll is processed. The HR team discovers that a rep was absent for three days in week two, but nobody flagged it at the time.
Each of these methods shares the same flaw: attendance data arrives after the window for action has closed. A dashboard changes this by making attendance a live operational metric rather than a retrospective record.
What the Attendance Dashboard Actually Shows
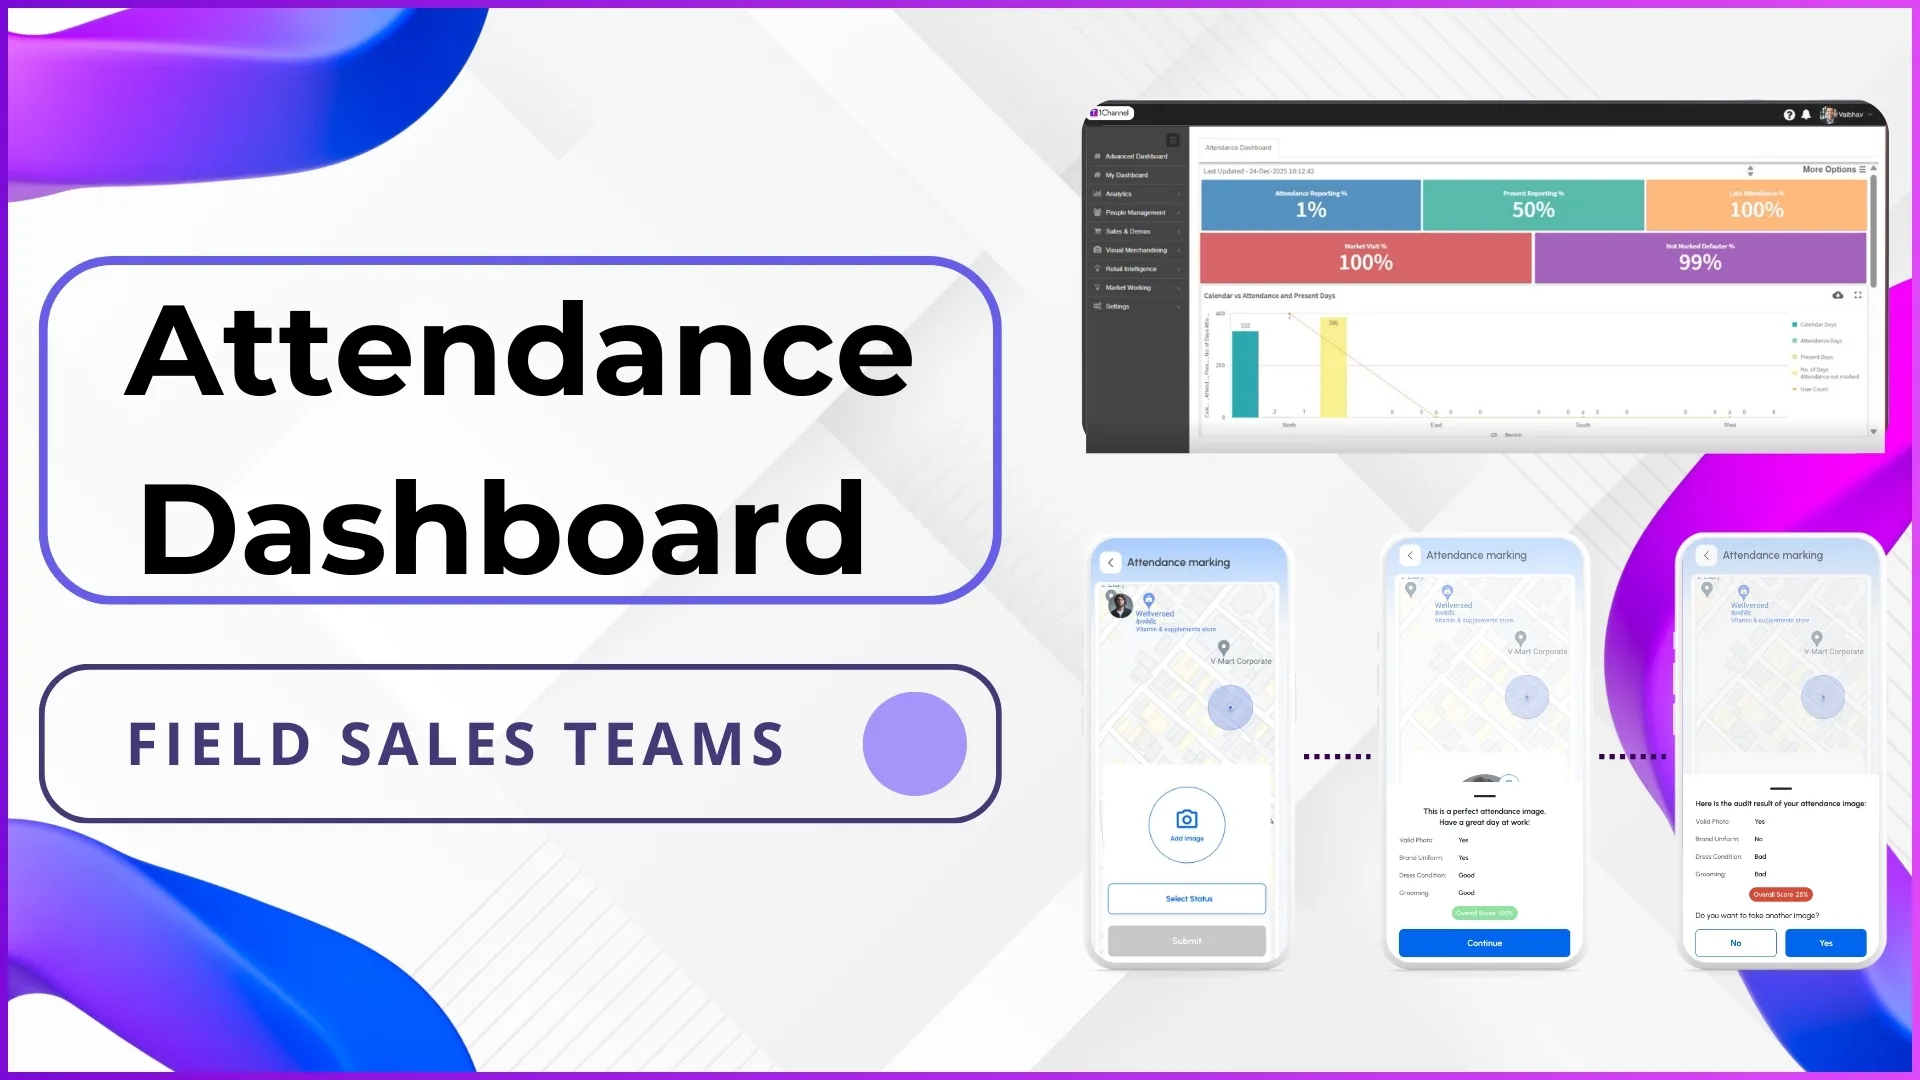
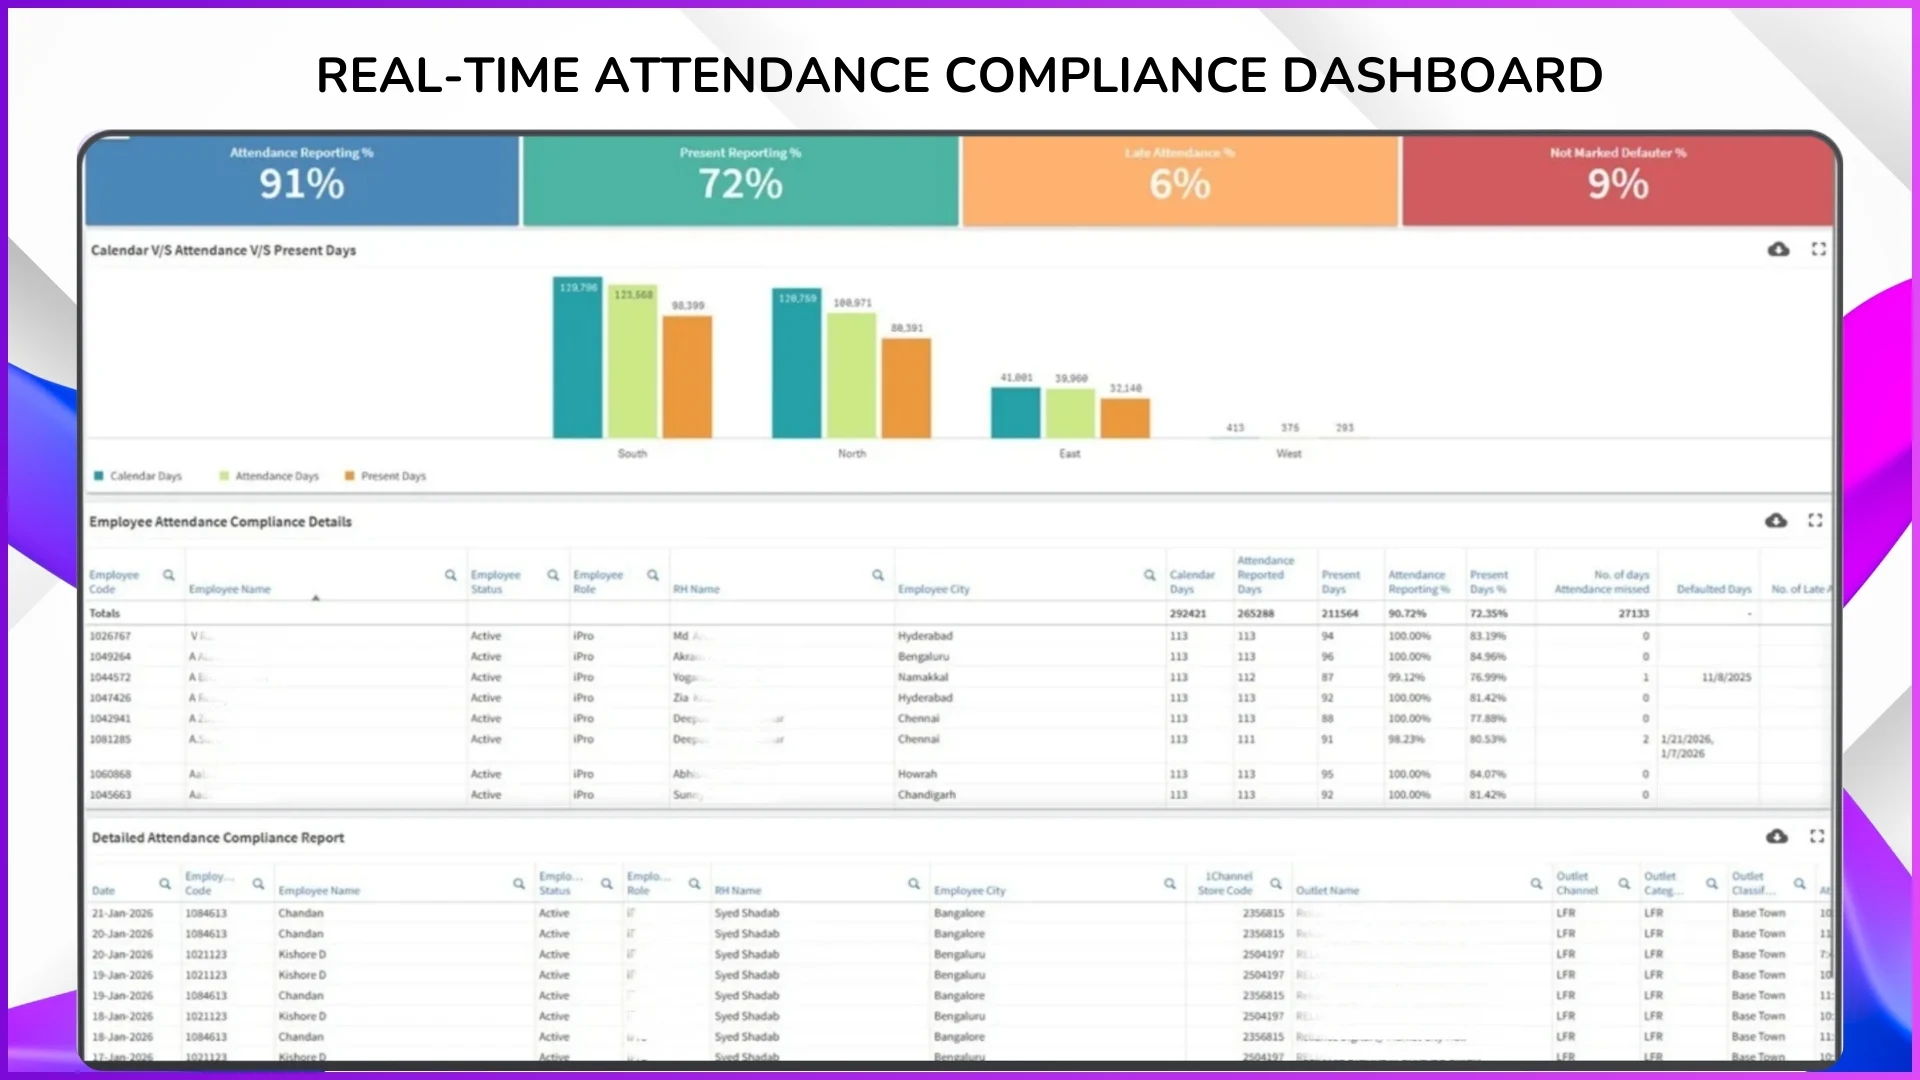
The attendance dashboard is the landing screen of the SFA admin portal. It pulls data from every attendance action submitted through the mobile app and presents it in a set of metrics that managers can read at a glance.
Real-Time Reporting Metrics
Attendance Reporting Percentage
The percentage of active employees who have submitted any attendance action today. If 45 reps are active and 38 have reported, this shows 84.4%. The remaining 7 are either unreported or have not opened the app yet.
Present Reporting Percentage
Among those who reported, how many marked themselves as "Present" versus other statuses such as on-duty, half-day, or leave. This distinguishes between reporting and actual field presence, a rep who reported "on leave" counts toward reporting percentage but not present percentage.
Late Attendance Percentage
Tracks reps who marked attendance after the configured time window. If the attendance deadline is 9:30 AM and a rep checks in at 10:15 AM, the system records it as late. This metric surfaces habitual latecomers before they become chronic defaulters.
Not-Marked Defaulters
Reps who have not submitted any attendance action by the current time. This is the most operationally urgent metric, it tells the manager exactly who is unaccounted for right now, enabling same-day follow-up rather than end-of-week discovery.
Market Visit Percentage
Shows the proportion of present reps who have actually started their market visits. A rep might mark attendance from home but delay heading to the field. This metric bridges the gap between attendance marking and actual field activity.
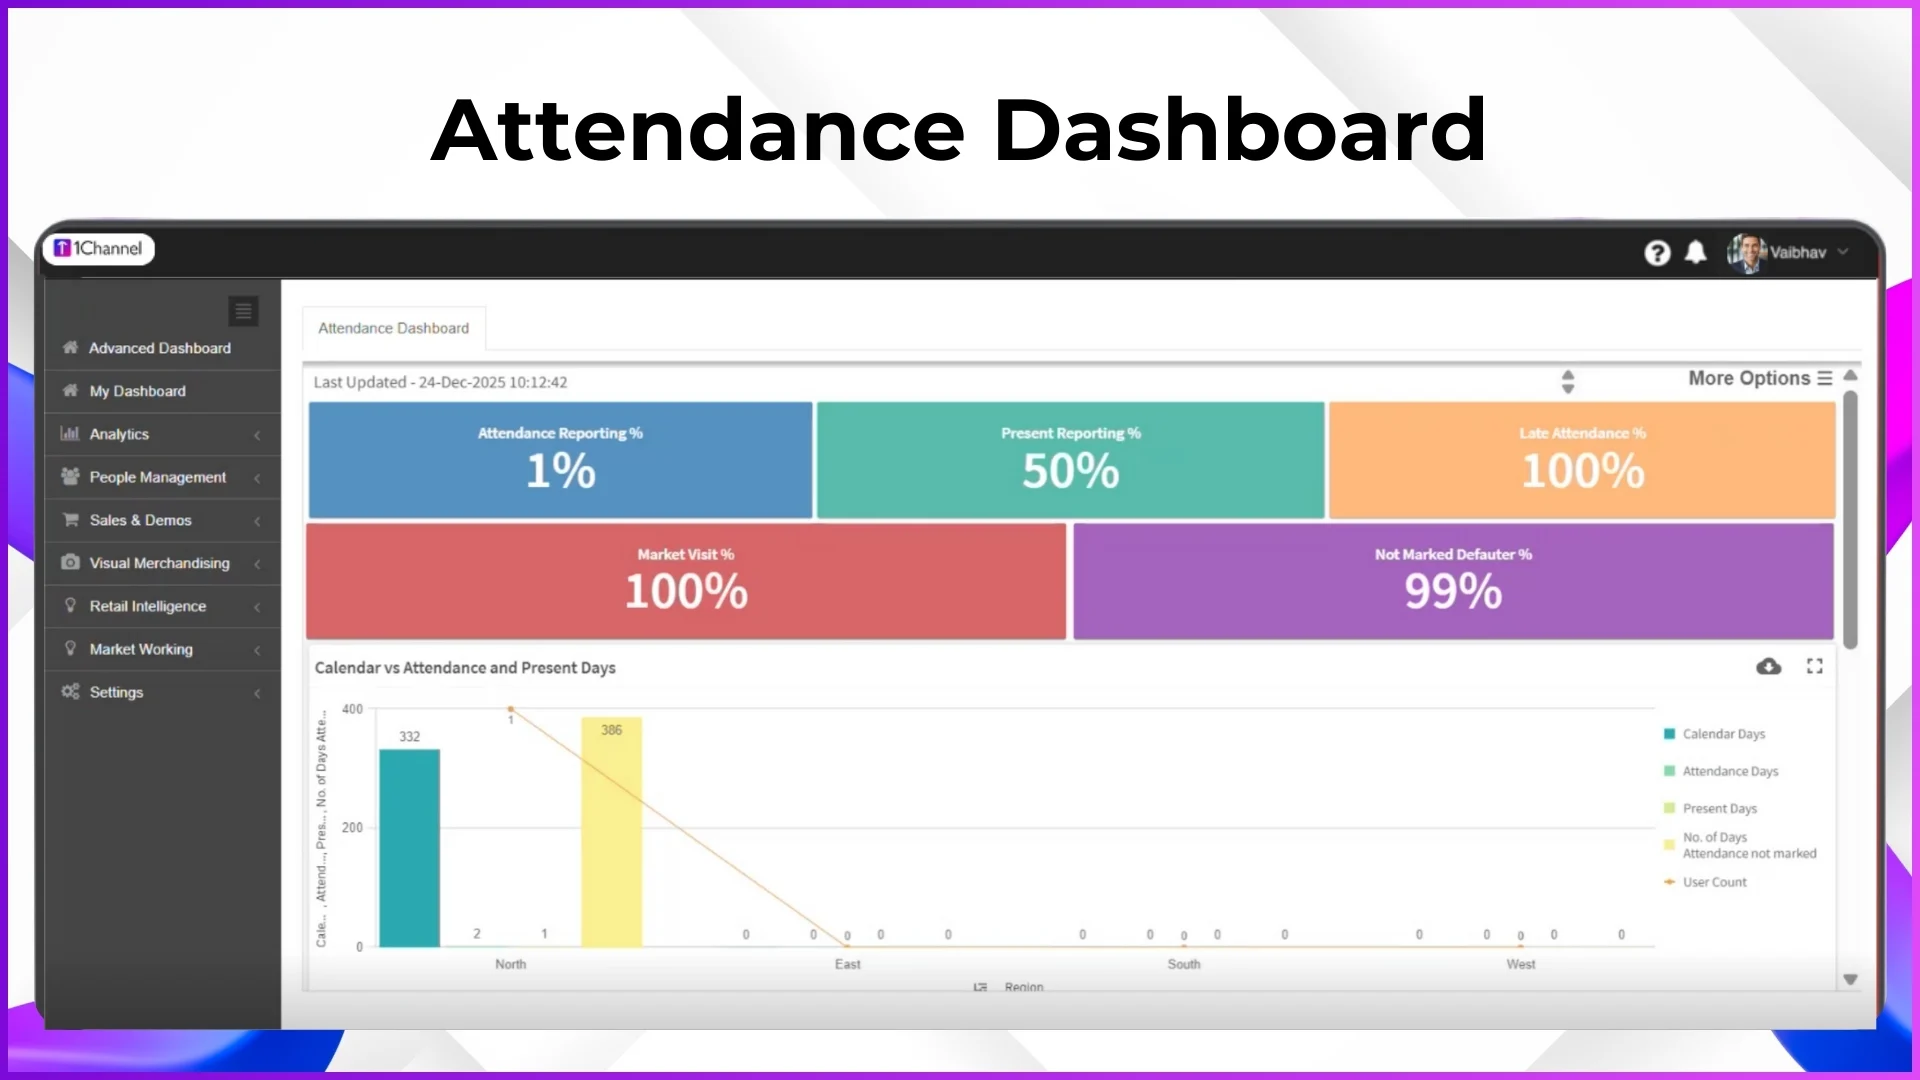
Calendar vs Attendance: The Monthly Compliance View
Beyond real-time snapshots, the dashboard includes a calendar-versus-attendance comparison table that shows each employee's attendance across the entire month. This view displays:
- Calendar working days that provides total business days in the month
- Attendance reported days that provides days the employee submitted any attendance action
- Actual present days that provides days marked as present (excludes leave, half-day, and other statuses)
- Missed days that provides working days with no attendance action at all
- Defaulted days that provides days where attendance was required but not submitted
- Late attendance count that provides number of days with late check-ins
For a company running field promoters across Klang Valley hypermarkets, this view answers a critical payroll question: did this promoter actually work 22 days this month, or is the claim based on estimated attendance? When the calendar view shows 22 present days, 1 leave, and 0 missed days, payroll processing becomes a verification step rather than a guessing game.
Employee-Level Compliance Details
The dashboard is not just a summary screen. It provides drill-down capability to individual employee records. The compliance detail table includes columns for:
- Employee code and name
- Current status (active, inactive, on probation)
- Role (promoter, team leader, area manager)
- Assigned city or territory
- Calendar days, reporting days, present days
- Attendance reporting percentage and present days percentage
- Number of missed days, defaulted days, and late attendance instances
A manager looking at this table can immediately spot that a promoter assigned to Penang has an 89% reporting rate but only a 72% present rate, meaning the rep is submitting attendance but frequently marking non-present statuses. This warrants a conversation, and the data makes it specific rather than anecdotal.
Filters for Targeted Analysis
Large field teams generate hundreds of rows of attendance data. The dashboard provides filters to slice the data by:
- Employee code or name that provides find a specific person instantly
- Role that provides compare attendance patterns between promoters and team leaders
- City or territory that provides see if attendance discipline varies by region (Klang Valley vs East Malaysia, for example)
- Status that provides filter active employees only, excluding those on extended leave or inactive
These filters transform raw attendance data into actionable intelligence. A regional manager covering five states can filter to Johor only and review compliance for just that territory before a scheduled call with the Johor team leader.
Who Sees What: Role-Based Dashboard Access
Not everyone in the organisation should see the same attendance data. The SFA platform enforces role-based access controls that determine what each user can view:
- Admin and operations managers see the full attendance dashboard across all teams, territories, and roles. They can filter, export, and drill down to any employee.
- Regional or area managers see attendance data only for employees who report to them. A Penang area manager cannot access attendance records for the Selangor team.
- Team leaders see their direct reports' attendance data, enabling first-level accountability without exposing organisation-wide metrics.
- Field employees see only their own attendance summary through the mobile app, their calendar view, present days, leave balance, and attendance history.
This hierarchy ensures data privacy while maintaining transparency at every management level. The permissions are configured from the admin portal's roles and permissions module, and changes take effect immediately across all users.
Explore Sales Force Automation
1Channel's cloud-based SFA platform includes real-time attendance dashboards, AI-validated check-ins, geofencing, and automated compliance reporting for distributed field teams.
Explore SFA Solutions →How the Attendance Dashboard Connects to Other Modules
Attendance data does not exist in isolation. Inside a cloud-based SFA platform, the attendance dashboard feeds into and draws from multiple connected modules:
Beat Plan Compliance
The system compares attendance status against the day's beat plan. If a rep is marked present but has not started any store visits by 11 AM, this gap surfaces in the market visit percentage metric. Beat compliance reports use verified attendance as the starting timestamp for calculating productive field hours.
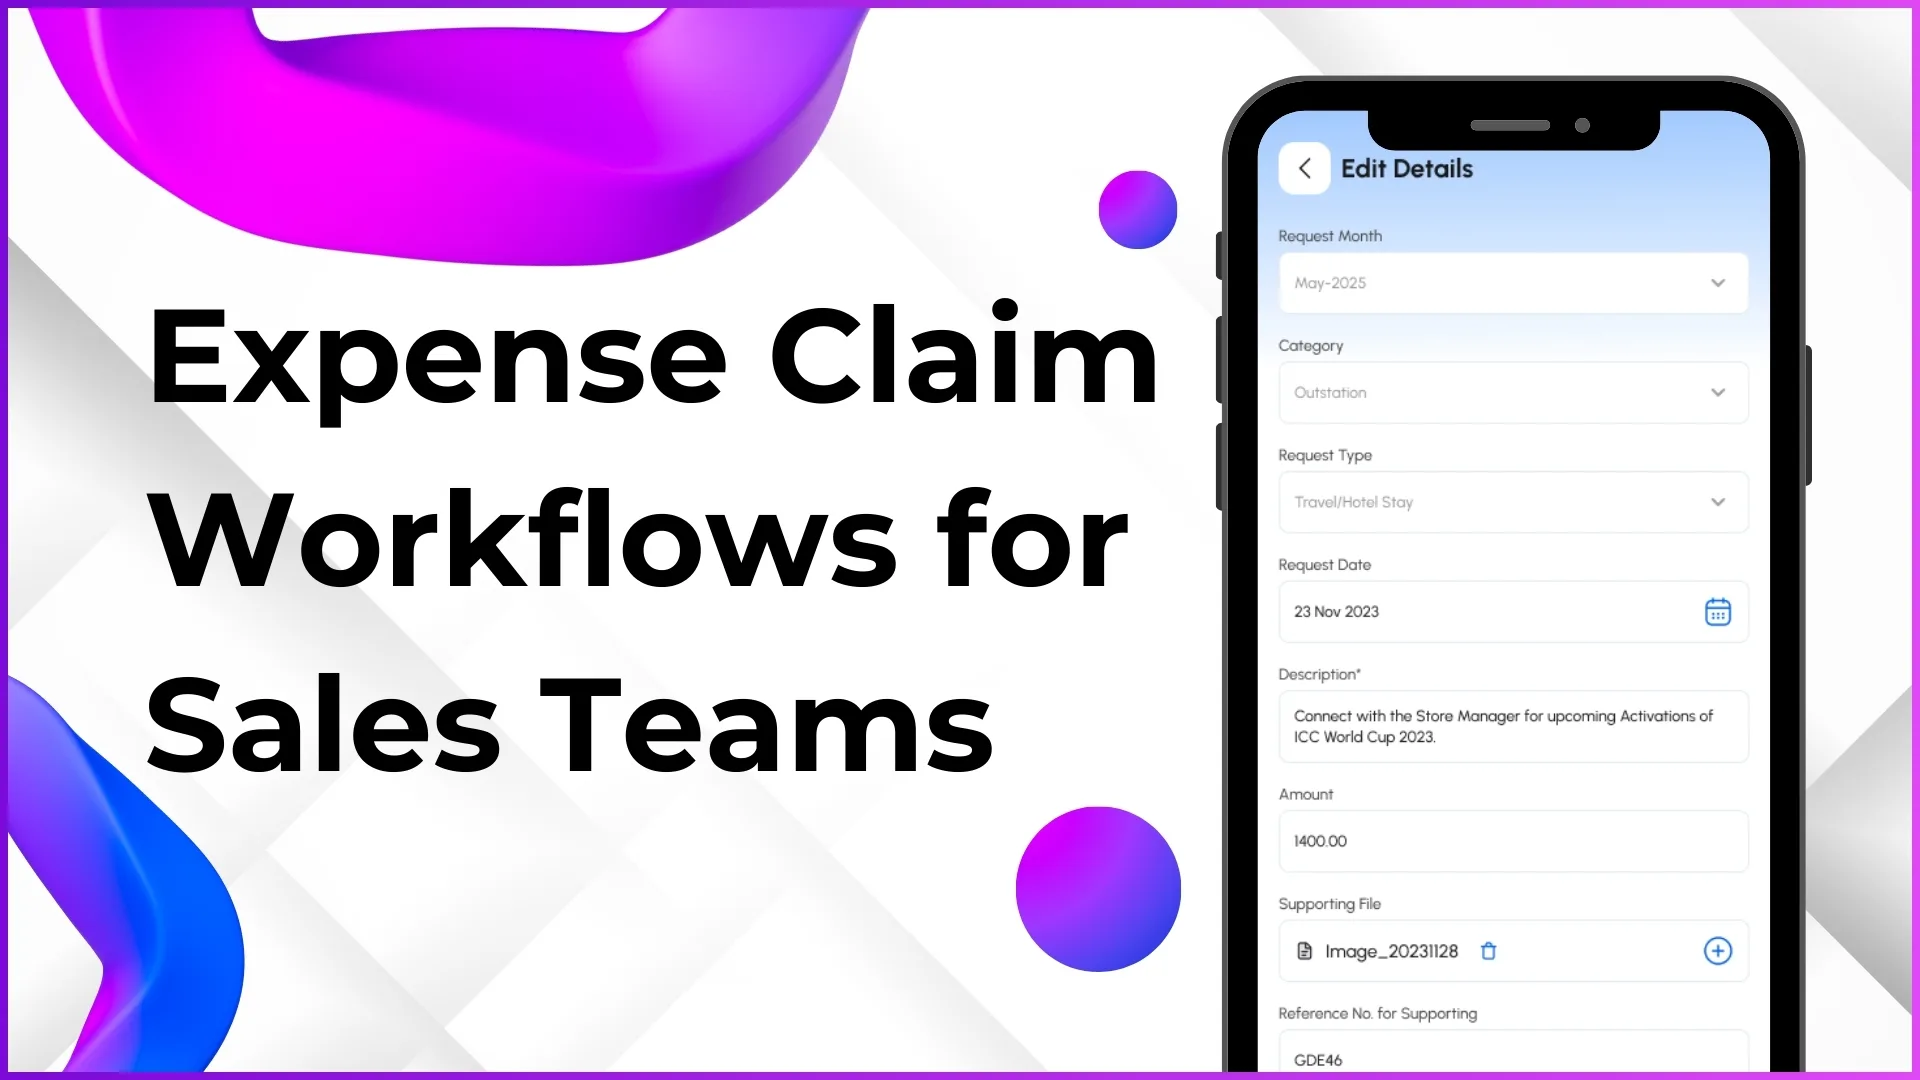
Expense Claim Validation
When a rep submits a fuel or toll claim for a specific date, the approval workflow cross-references that date against attendance records. A claim for a date where the rep was absent or on leave is automatically flagged. This integration prevents expense leakage without requiring manual cross-checking by managers.
Payroll and HR Integration
The attendance closure module consolidates monthly attendance data, present days, leave days, half-days, regularised entries, into a payroll-ready format. HR teams use this as the verified source for salary processing instead of relying on manually compiled spreadsheets. Leave balances are automatically adjusted as leave requests are approved and attendance records are finalised.
Performance Analytics
Attendance compliance feeds into individual and team performance scorecards. A rep with 95% attendance and 88% beat compliance presents a very different performance profile than a rep with 78% attendance and the same beat compliance. The analytics module uses attendance as a foundational input for productivity calculations.
Attendance Analytics: Patterns, Not Just Numbers
The dashboard's analytics layer transforms daily attendance entries into trend data that supports strategic decisions. Key patterns that surface over time include:
- Monday and Friday absenteeism spikes. Common in field teams where reps extend weekends. The dashboard quantifies this pattern so managers can address it with data rather than suspicion.
- Regional compliance variations. A company might discover that attendance compliance in East Malaysia consistently trails Peninsular Malaysia by 8 to 10 percentage points, signalling a need for different management approaches or scheduling adjustments.
- Seasonal attendance dips. During festive periods like Hari Raya or Chinese New Year, attendance patterns shift. Historical dashboard data helps managers plan coverage proactively rather than reacting to sudden shortages.
- New hire onboarding gaps. Reps who joined in the last 90 days may show irregular attendance patterns as they adjust to field routines. Identifying this early allows team leaders to provide targeted support.
These patterns turn attendance from a compliance checkbox into a management tool. Instead of asking "who was absent today," managers start asking "why does attendance drop in this territory every third week", and the dashboard provides the data to investigate.
What Field Reps See on Their App
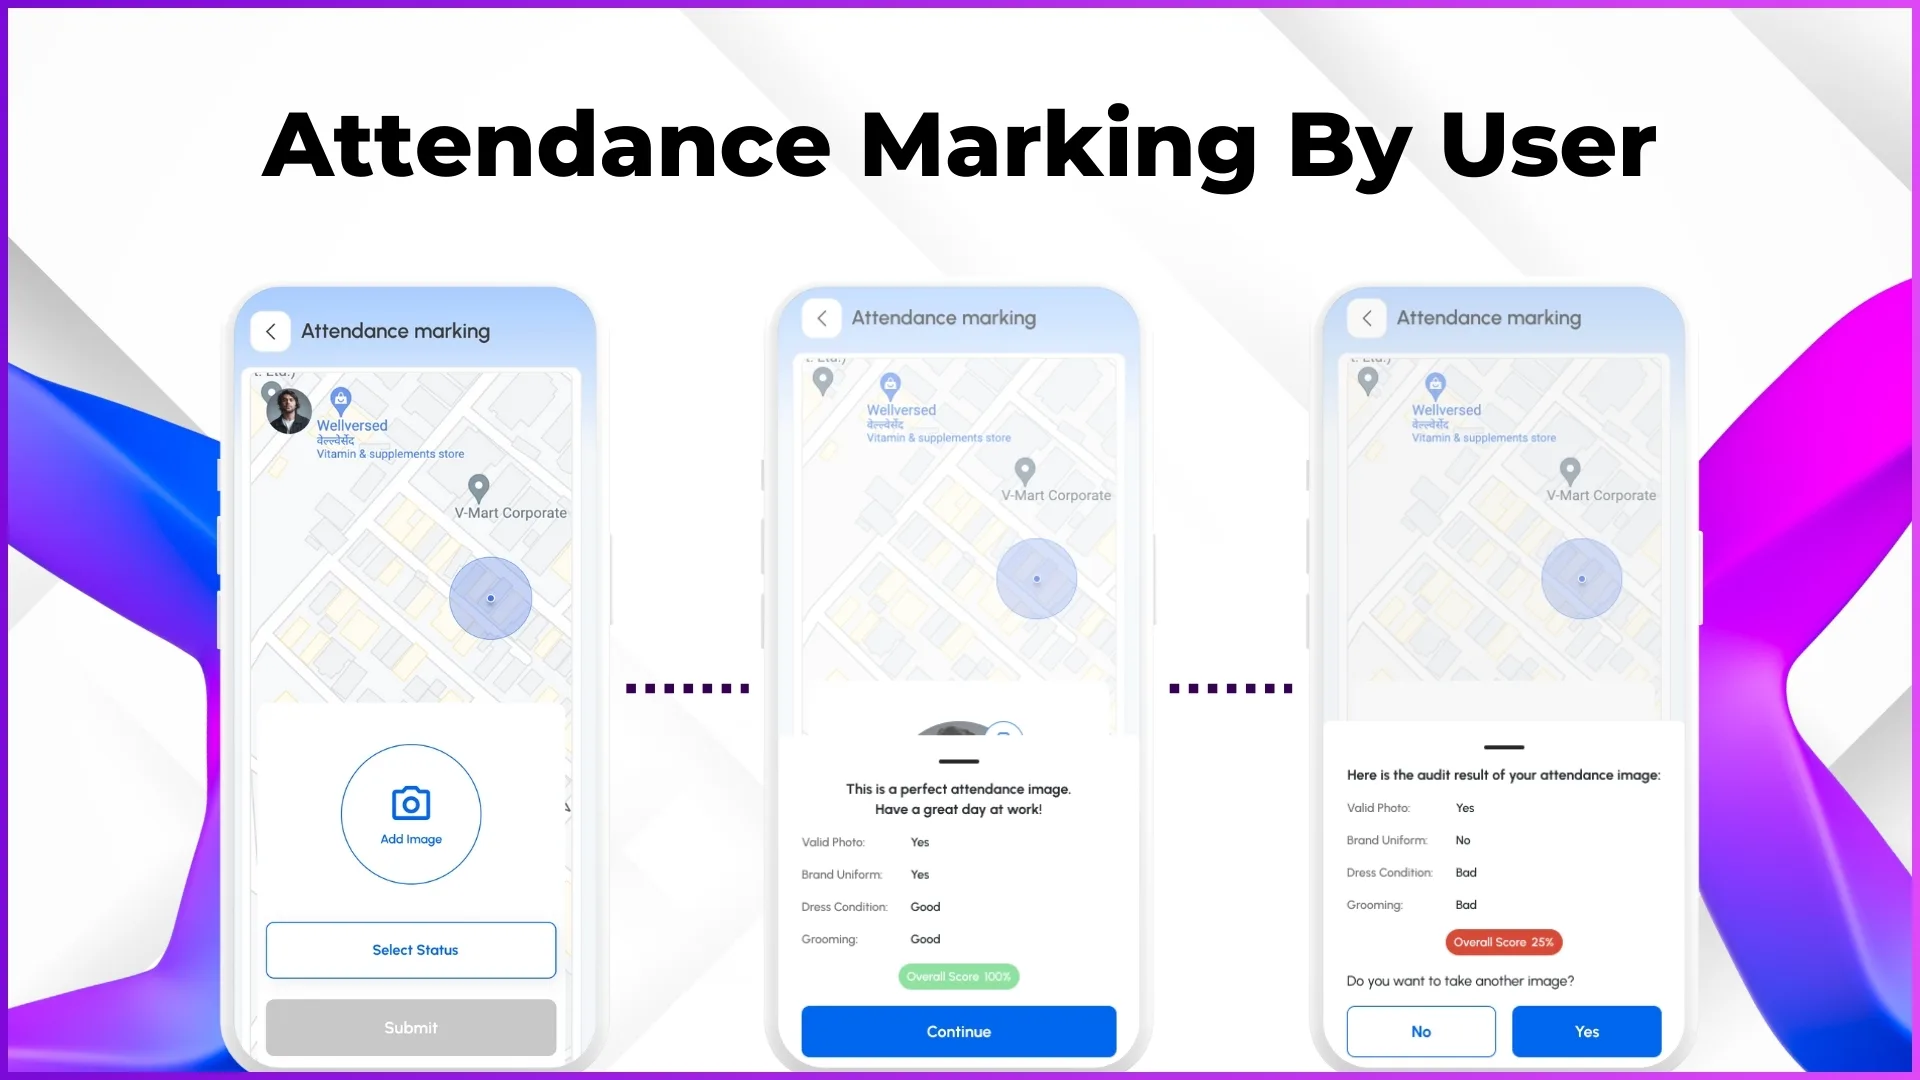
The attendance dashboard is an admin-side tool. Field representatives interact with attendance through their SFA mobile app, which provides a streamlined personal view:
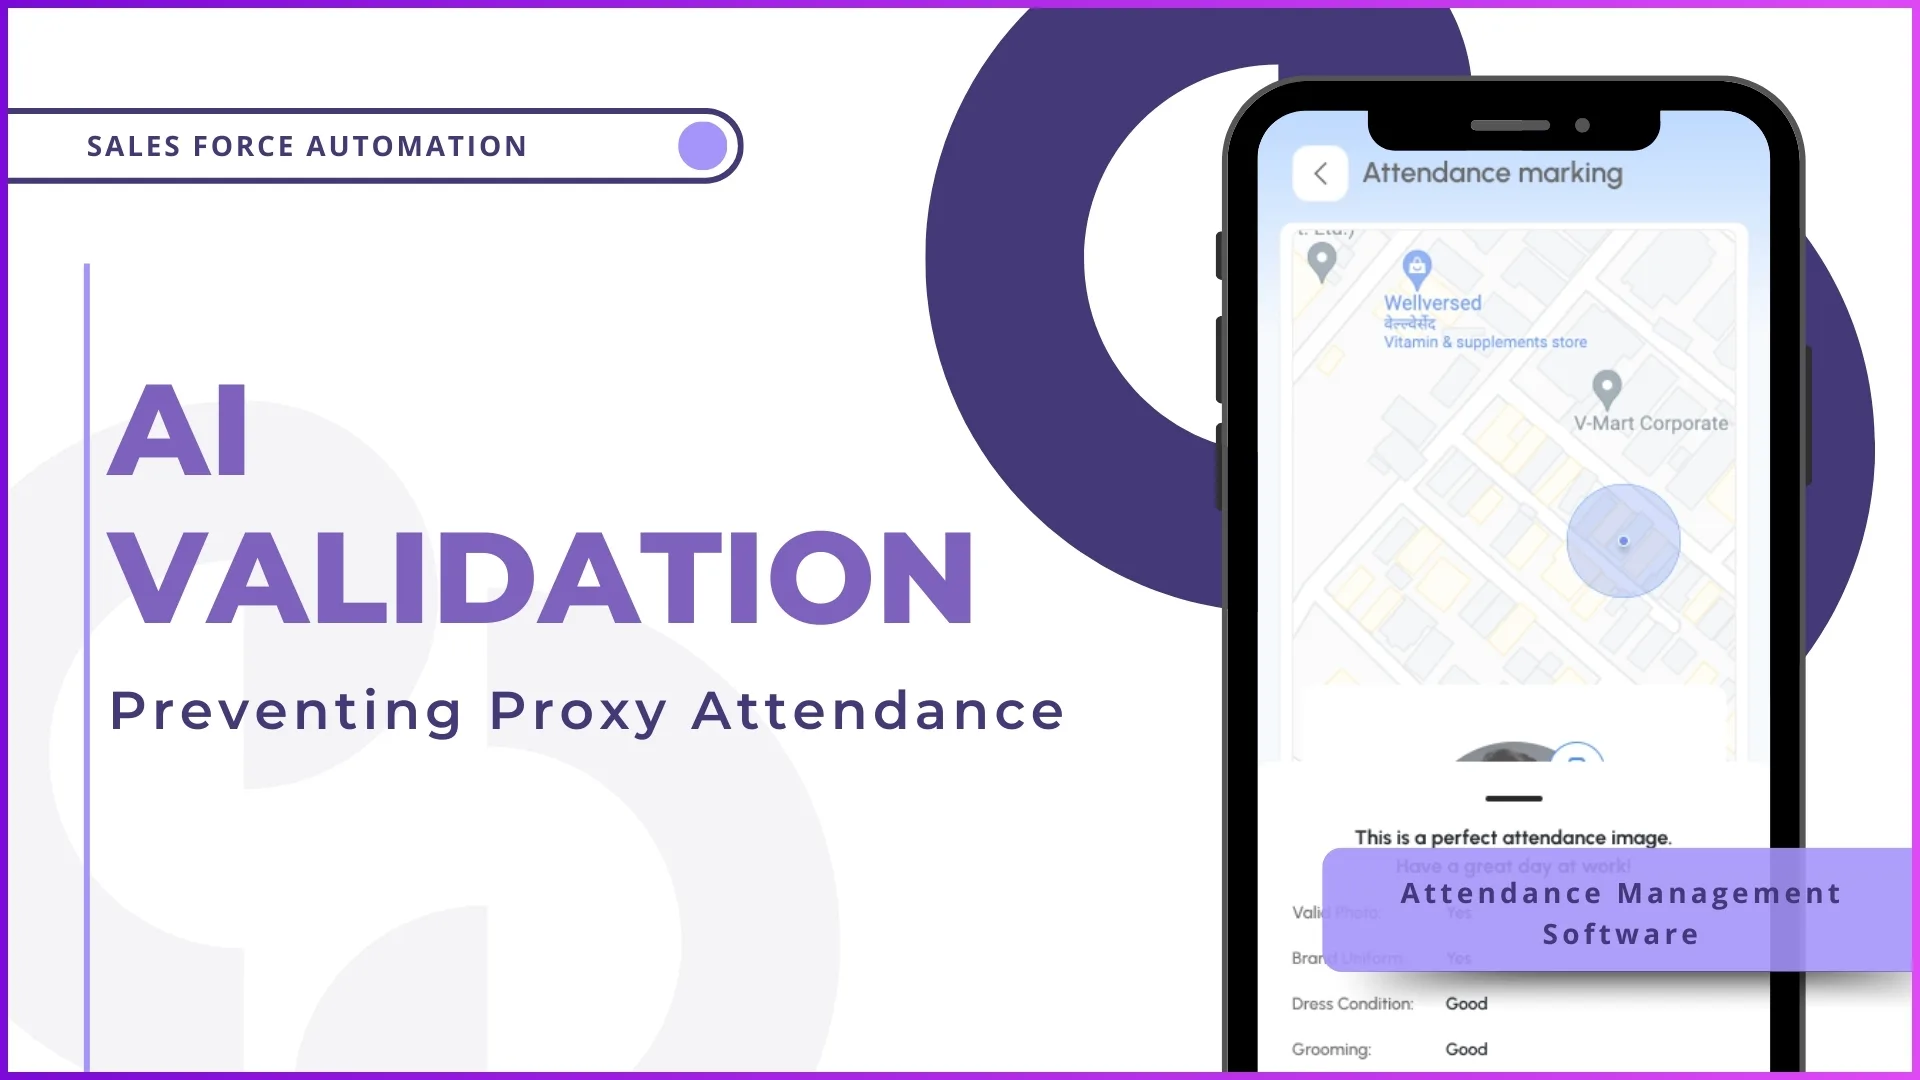
- Attendance marking with configurable options: present, half-day, on-duty, sign-out. AI face validation and GPS capture happen automatically during the check-in process.
- Attendance summary calendar showing a colour-coded monthly view where green indicates present, yellow for late, red for absent, grey for leave. Reps can see their own compliance at a glance.
- Regularisation requests for missed or incorrect attendance. If a rep forgot to mark attendance due to a connectivity issue in a rural area, they can submit a regularisation request with a reason, which routes to their manager for approval.
- Leave application integrated directly into the attendance module. Reps apply for casual leave, earned leave, or other configured leave types, and approvals flow through the reporting hierarchy.
The mobile view is designed for speed. Marking attendance takes under 15 seconds including the AI face validation. The goal is zero friction for the rep, maximum data for the manager.
Frequently Asked Questions
Can the attendance dashboard be customised for different organisations?
Yes. The dashboard elements are configurable based on the organisation's requirements. Some businesses prioritise market visit percentage alongside attendance, while others focus on late attendance tracking. The admin portal allows configuration of which metrics appear, what attendance statuses are available, and how the compliance calculation works.
What happens when a rep has no mobile connectivity while in the field?
The SFA app supports offline attendance marking. The rep marks attendance locally on their device, and the data syncs to the dashboard automatically when connectivity is restored. This is particularly relevant for reps covering rural outlets in Pahang, Kelantan, or interior Sabah and Sarawak.
How does the dashboard handle different time zones within Malaysia?
Malaysia operates on a single time zone (MYT, UTC+8) across both Peninsular and East Malaysia, so time zone differences do not affect attendance calculations. However, if an organisation has operations extending into neighbouring countries with different time zones, the system can be configured accordingly.
Can attendance data be exported for external payroll systems?
Yes. The attendance closure module generates exportable reports in formats compatible with common payroll systems. Data includes employee codes, present days, leave days, regularised entries, and overtime, structured for direct import into payroll processing software.
Is the random attendance check a separate feature?
Yes. Beyond the morning check-in, the system can be configured to send random attendance prompts during the day. These require the rep to submit a live photo with GPS verification, confirming they are still in the field. Random check results appear in the dashboard alongside standard attendance data.
Conclusion
An attendance dashboard is not a monitoring tool. It is a management tool. The difference matters. Monitoring implies watching. Management implies acting on what you see. When a manager opens the SFA portal at 9:15 AM and sees that 4 out of 45 reps have not reported, they can call those 4 reps immediately. When the monthly view shows a rep with 6 late days and 3 missed days, the manager has specific data for a performance conversation.
For Malaysian businesses managing field sales teams across multiple states, the attendance dashboard closes the gap between what management assumes is happening in the field and what is actually happening. Every metric on the dashboard, reporting percentage, present percentage, late count, defaulter list, exists to make that gap as small as possible.
The field sales day starts with attendance. Making sure that starting point is verified, visible, and actionable is what separates operationally disciplined organisations from those still relying on trust and guesswork. Get in touch to see how 1Channel's attendance dashboard works for distributed field teams.