Beat compliance is the discipline of whether the rep actually visited the planned outlets on the planned days. The dashboard reads that discipline at a glance, by region, by week, by rep.
Compliance under 70 percent reads as a planning problem. Compliance under 50 percent reads as a market-share problem before the next quarter is out.
The dashboard below carries twelve screens that together tell the full beat-compliance story. Each one answers a slightly different question, and reading them in sequence is how the leader gets to the right intervention.
Table of Contents
What 'Beat Compliance' Actually Measures
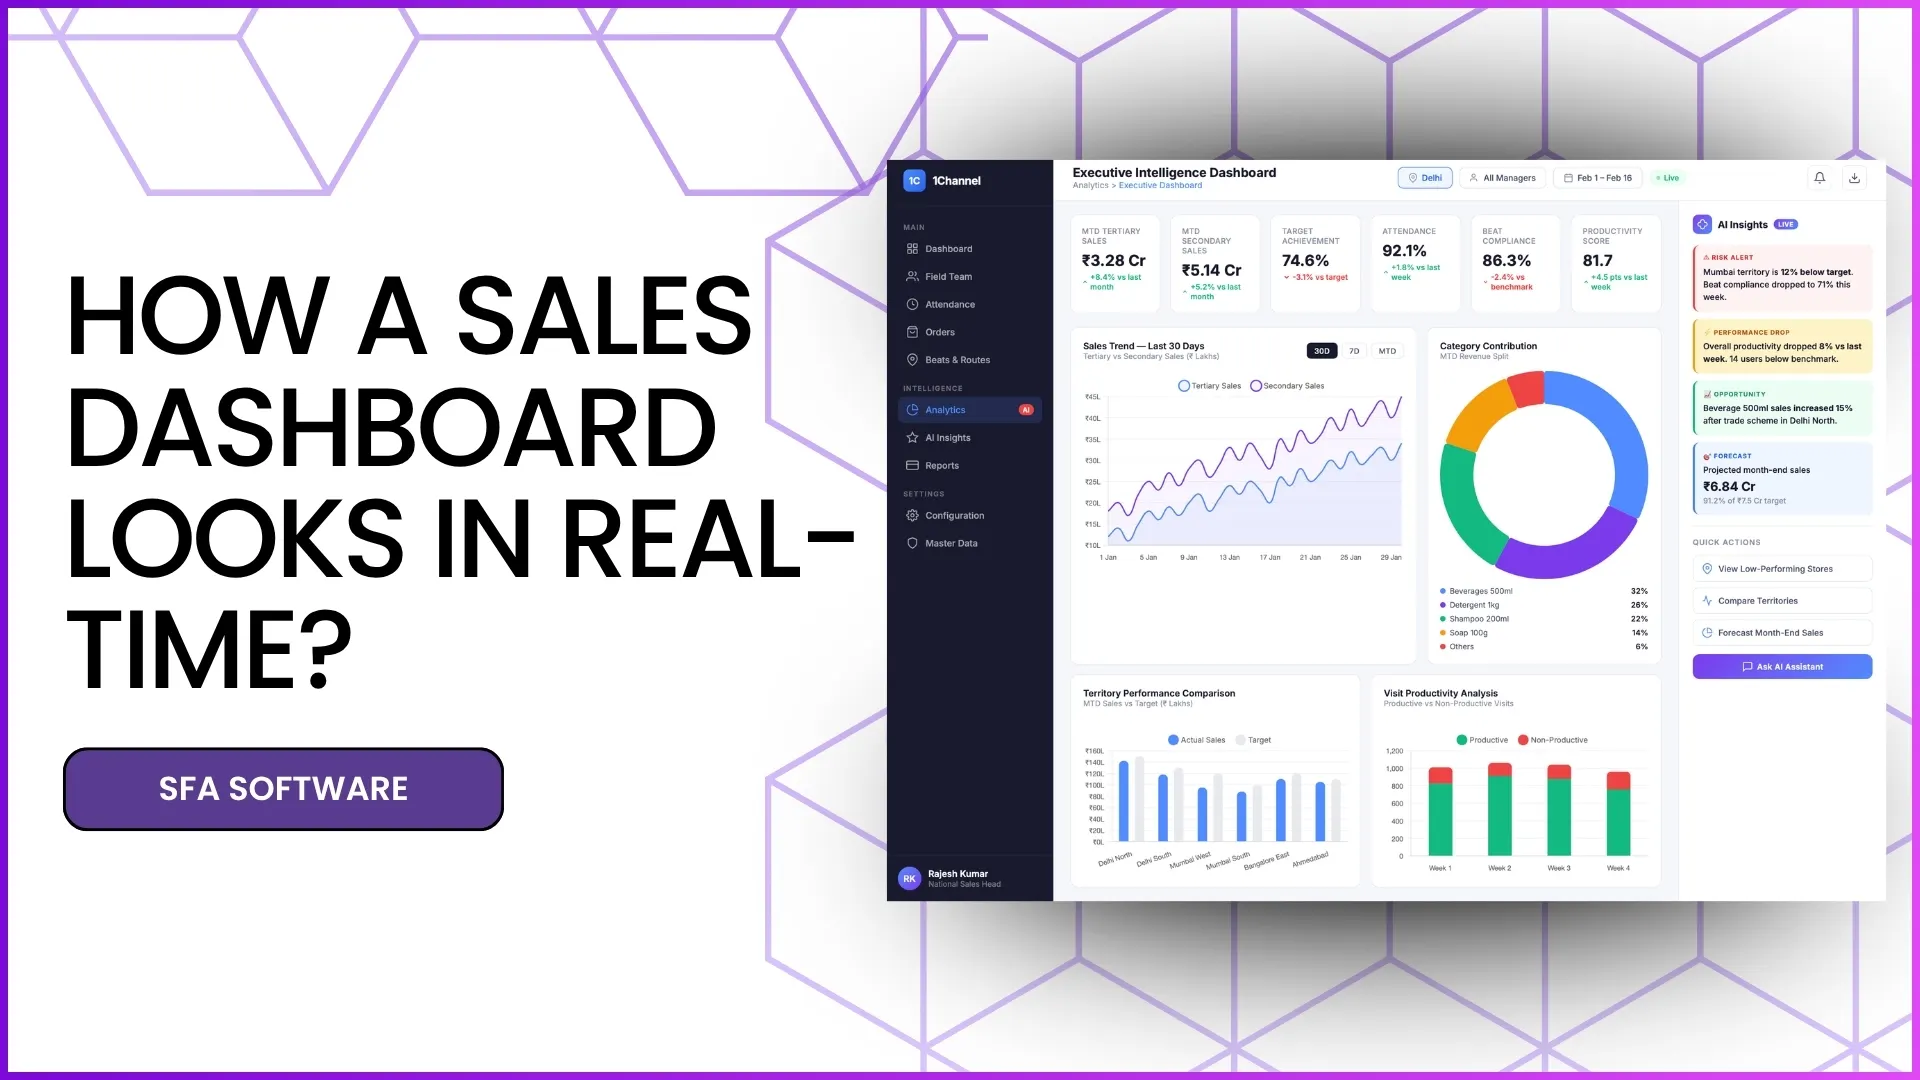
Beat compliance is the percentage of planned visits that closed on the planned day, by the planned rep. The metric reads simply at the headline level, but the dashboard underneath breaks it down by rep, by region, and by outlet grade.
The cloud platform recomputes the number automatically as visits land. The reader trusts the figure to be current, and the conversation about what to do moves faster as a result.
Twelve Live Screens Inside the Beat Compliance Dashboard
Each screen below answers a different operational question. Together they form the full beat-compliance read-out:
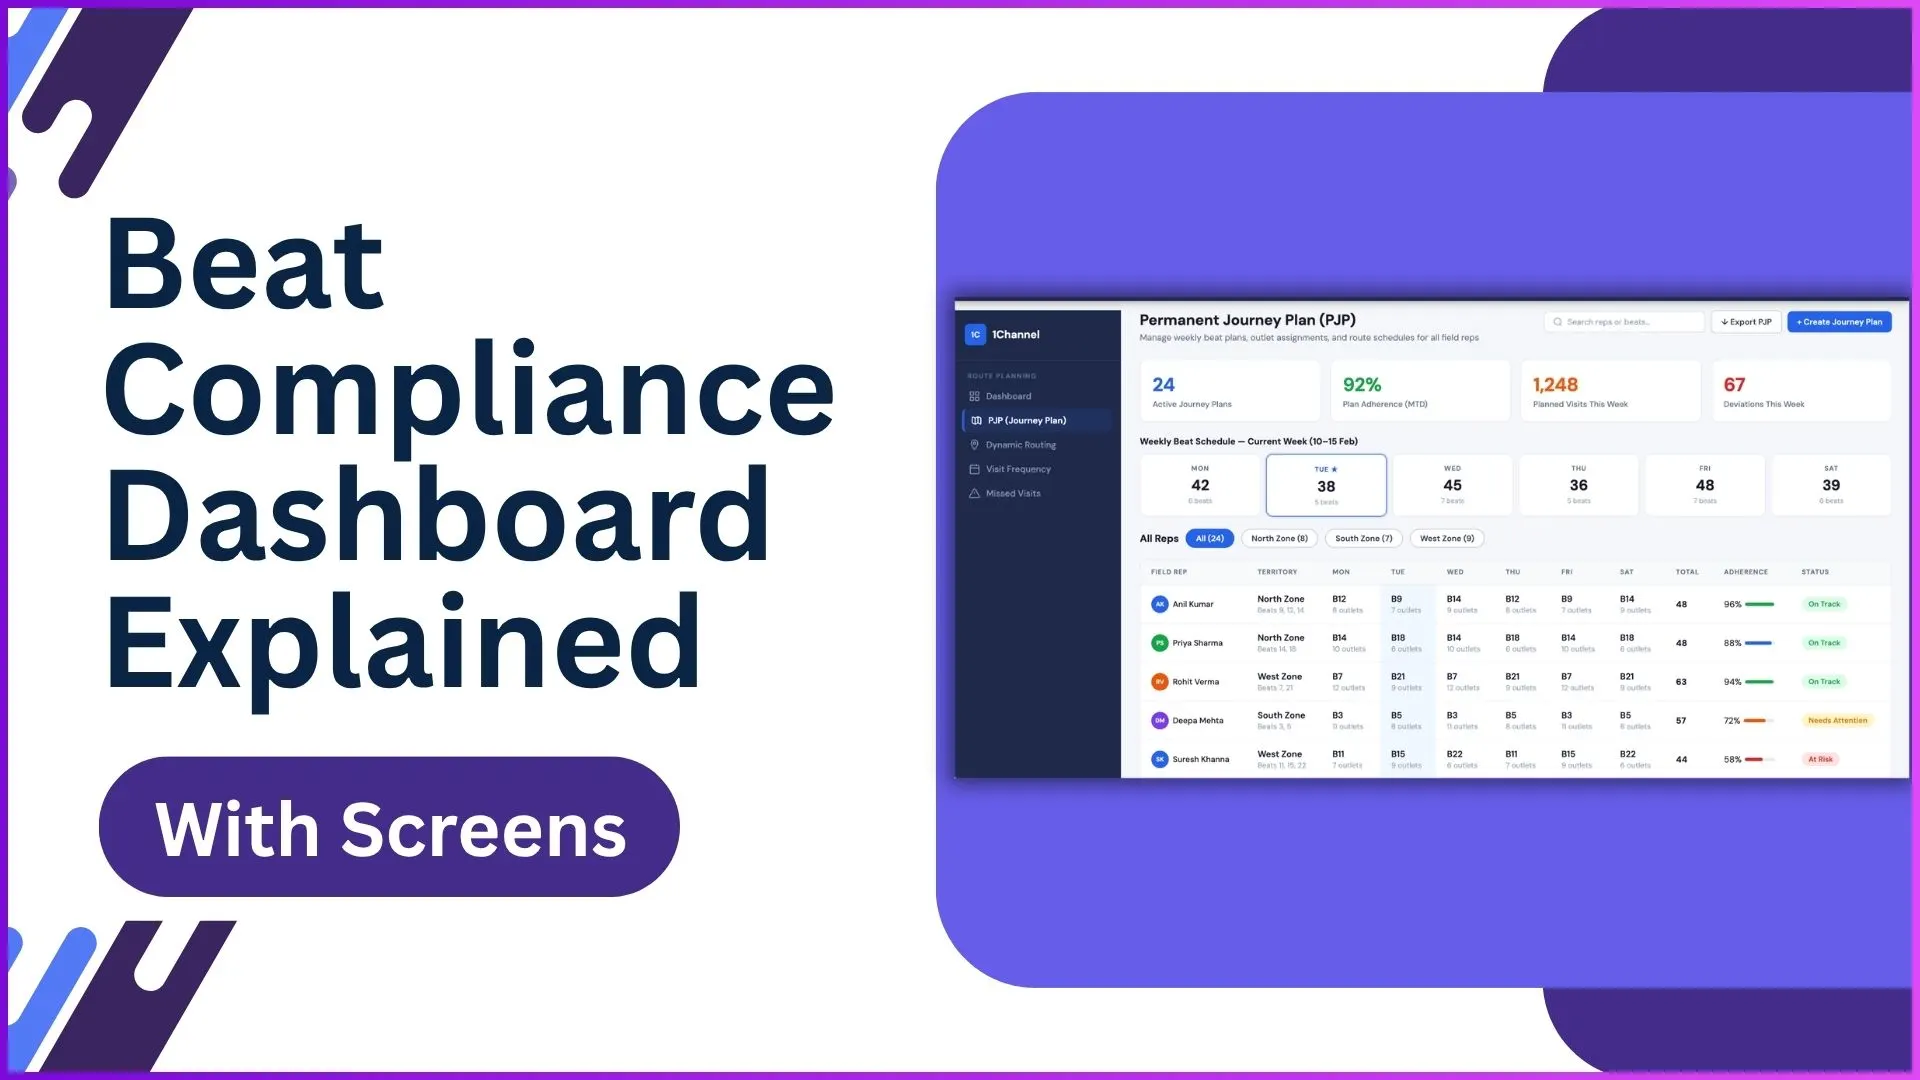
1. Journey Plan KPIs
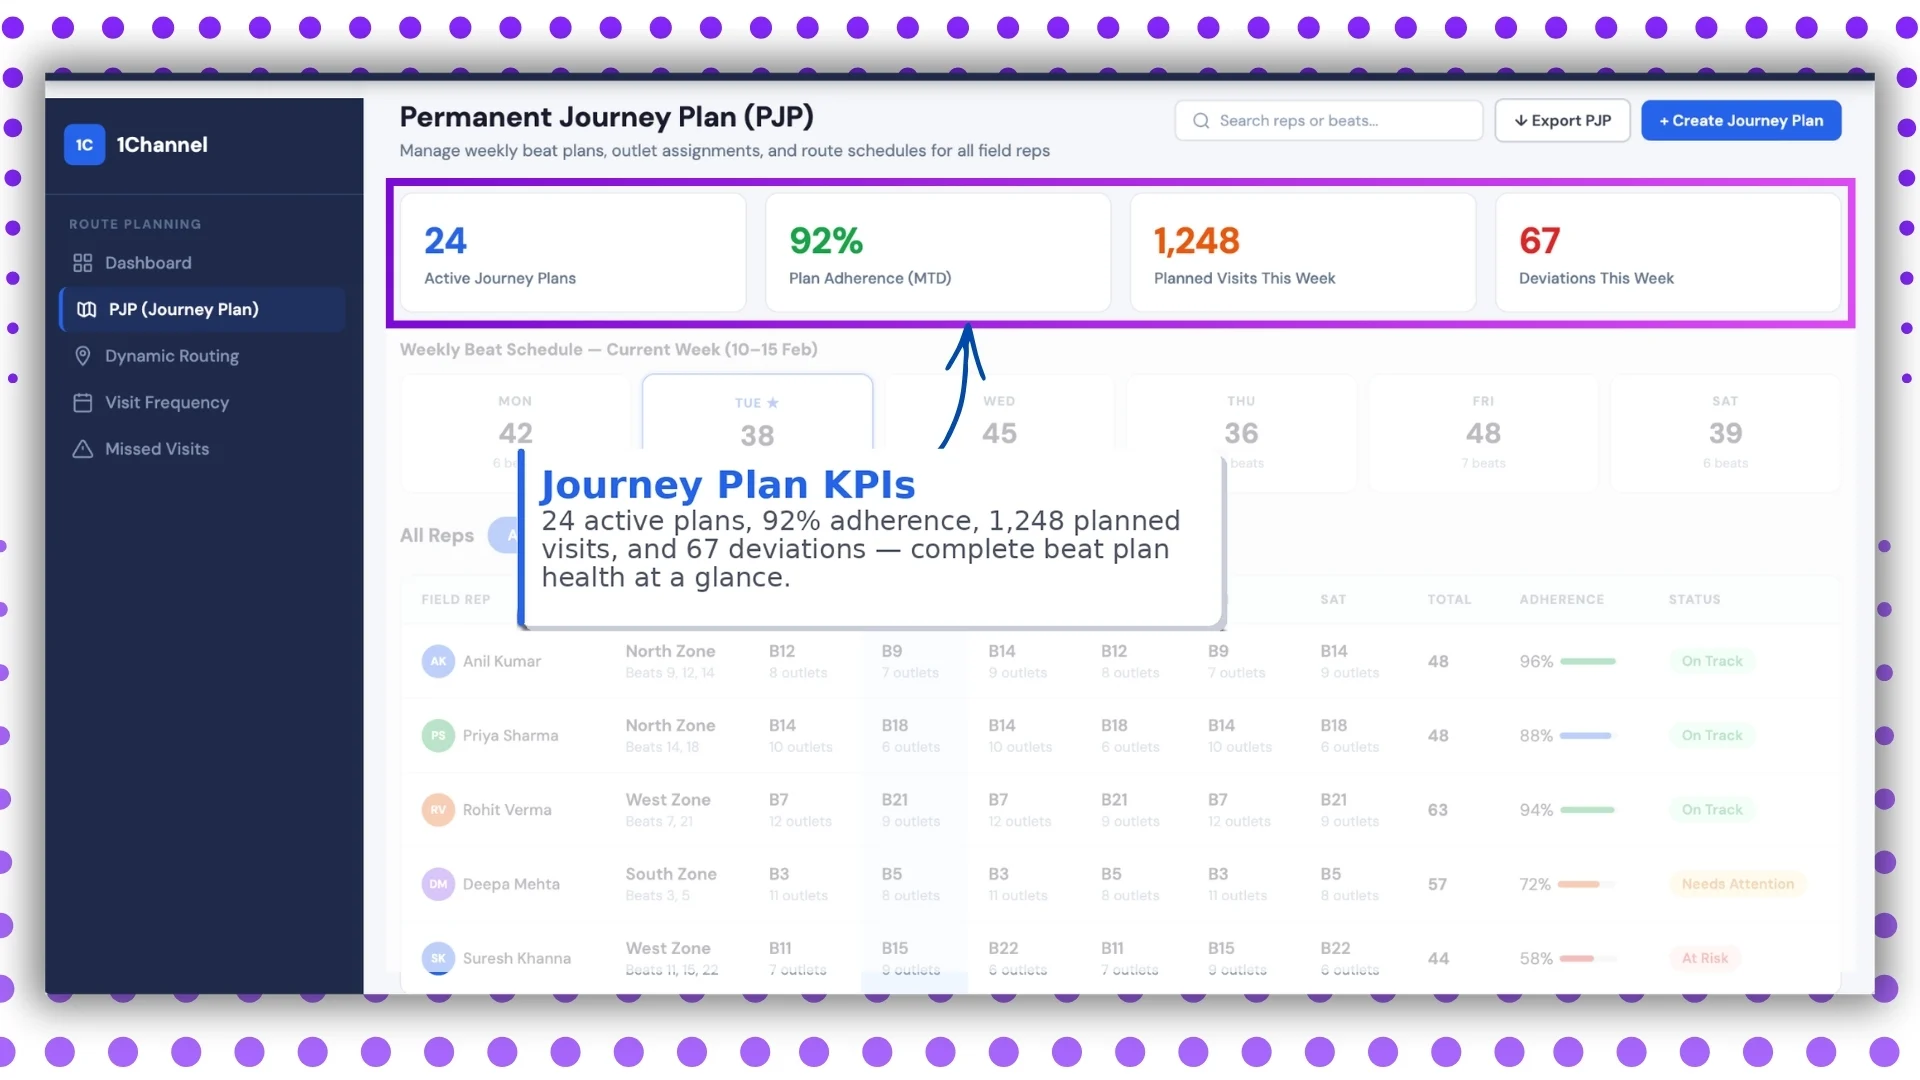
The top-level summary. Planned visits, actual visits, compliance percentage, missed visits, and recovery rate, all displayed at the headline level for the leader's 10-second scan.
2. Weekly Beat Schedule
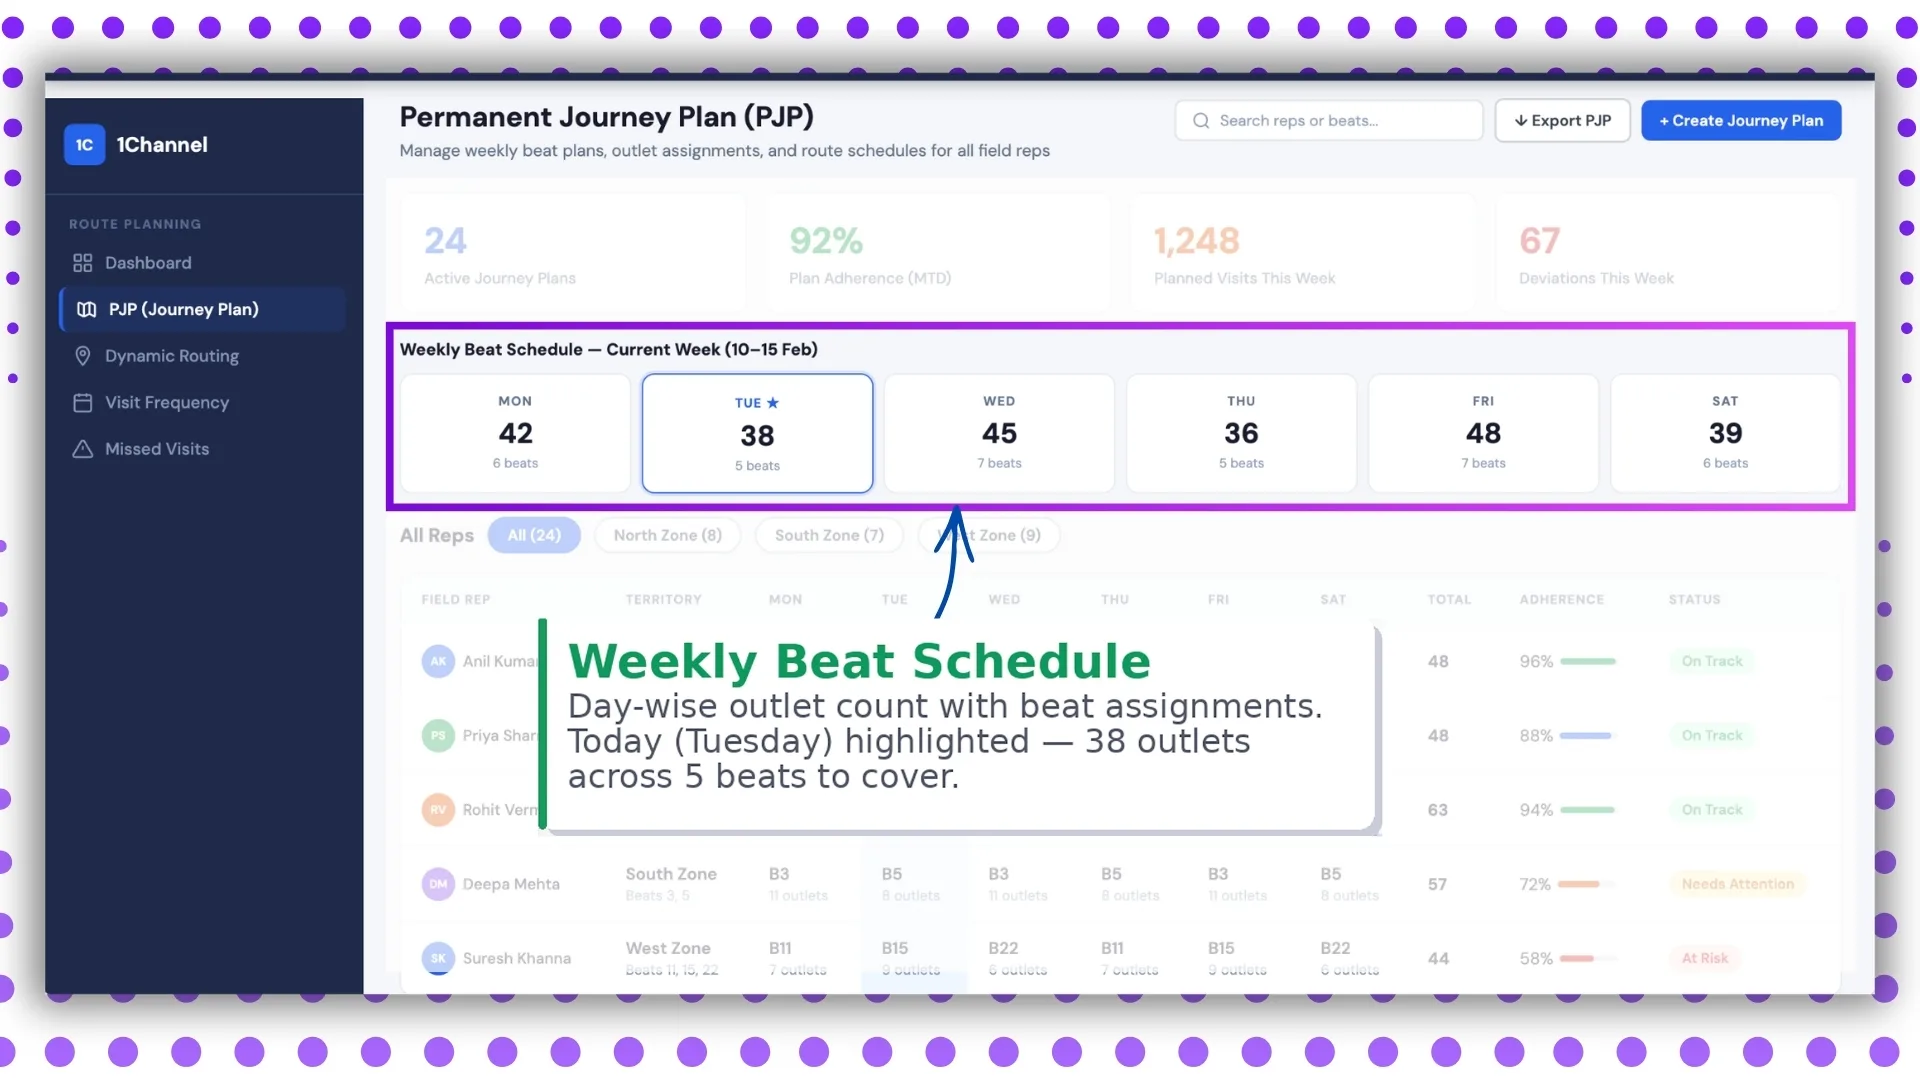
The week's plan laid out by rep and by day. Colour codes flag the days where the rep is overloaded or where outlets sit on the gap.
3. Field Rep Adherence Tracker
Each rep's compliance score against their own beat plan. Sorts the team by compliance descending, so the laggards stand out for coaching before the absolute number is reviewed.
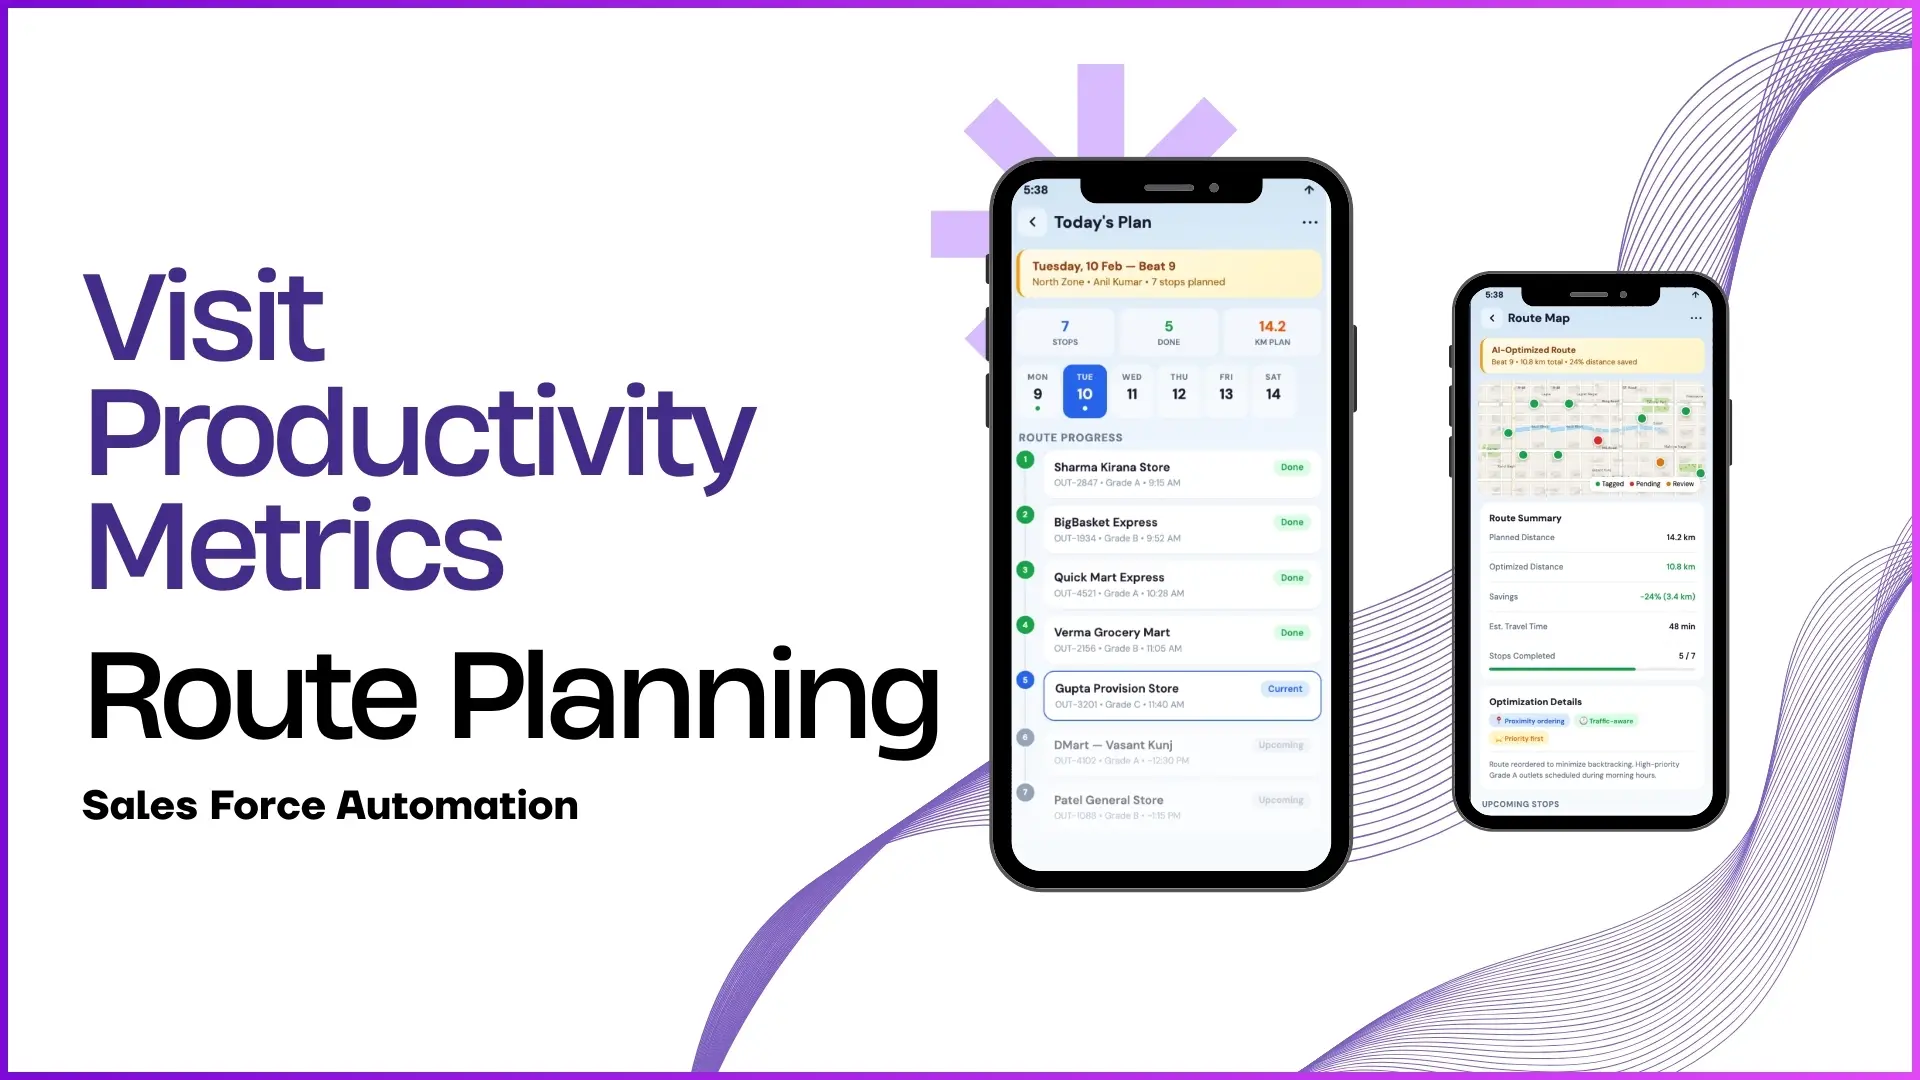
4. AI Route Optimisation
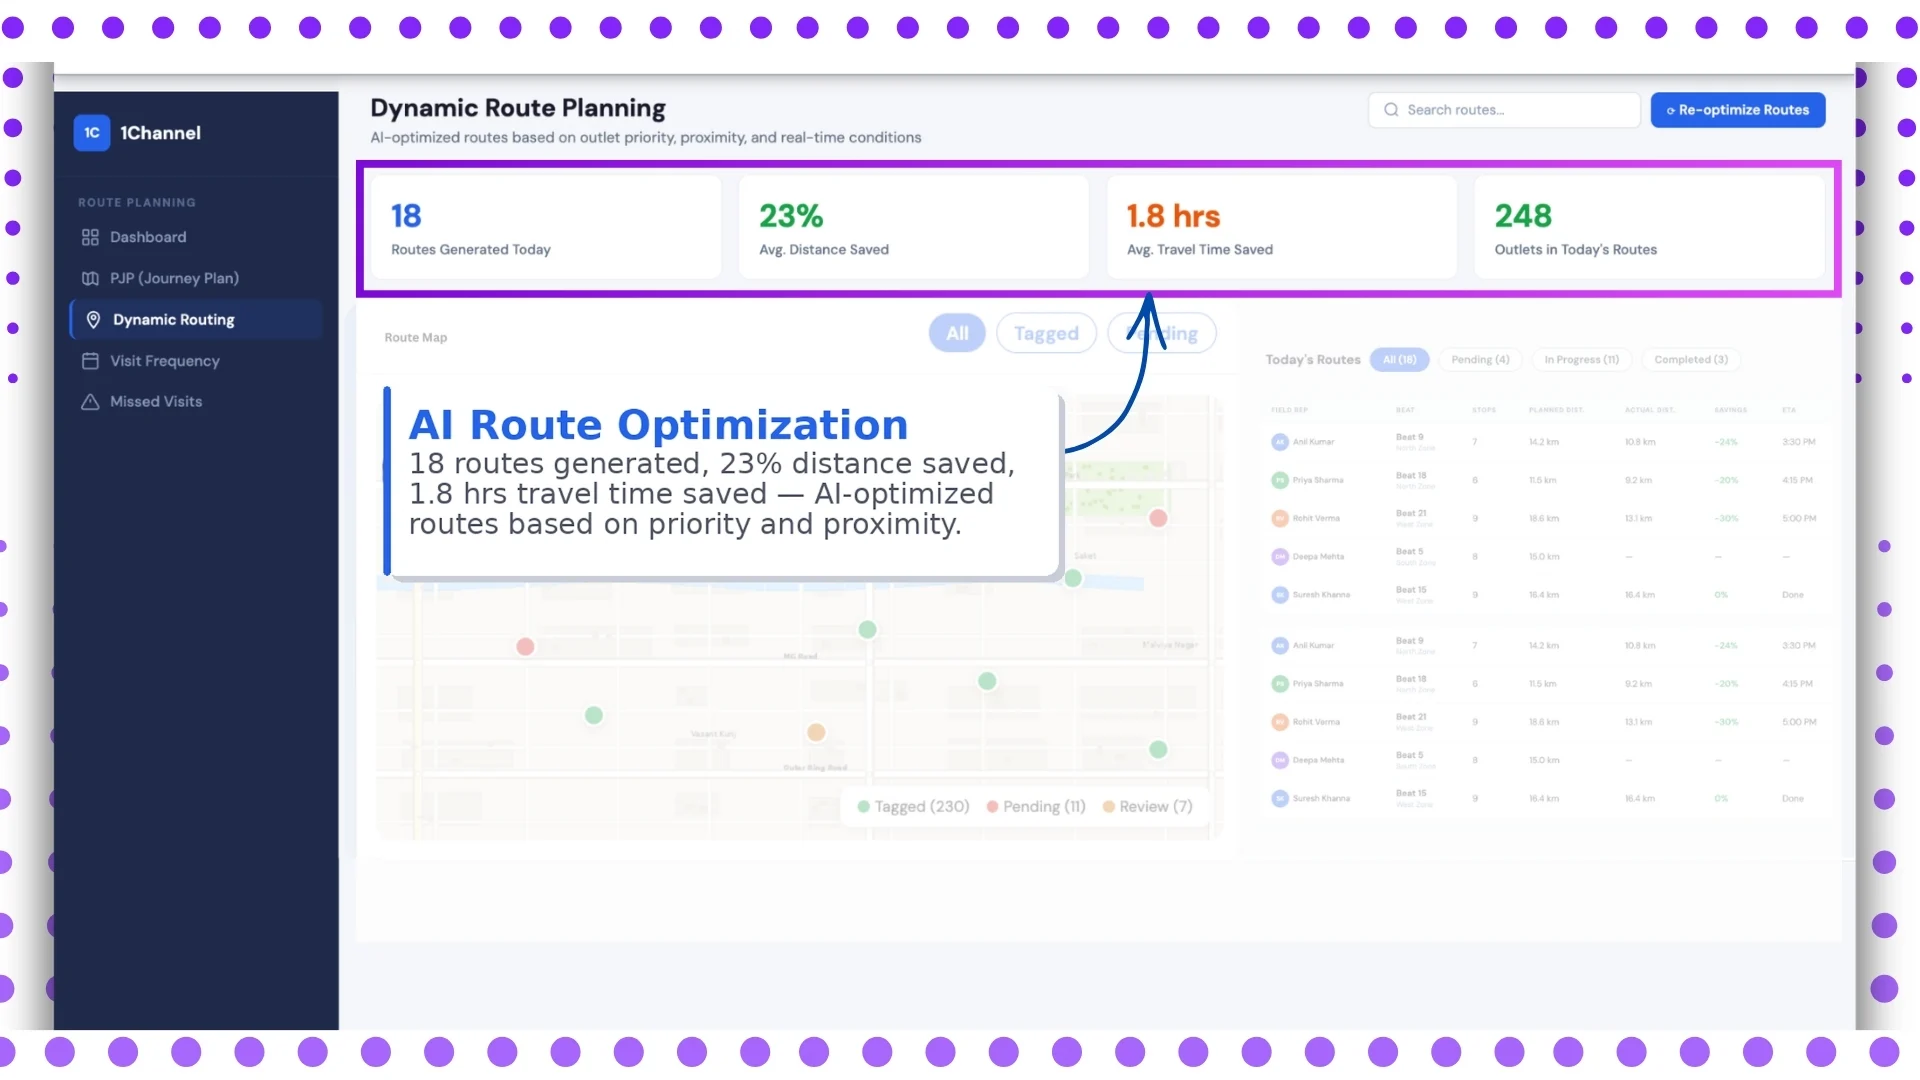
Suggested routes computed against traffic, distance, and outlet priority. The rep gets a starting route every morning, and the AI engine reshuffles if the day's plan shifts.
5. Live Route Map
GPS tracking of every rep against their planned route. The leader sees who is on plan, who is delayed, and where the operational congestion is concentrated, without making phone calls.
6. Route Performance Table
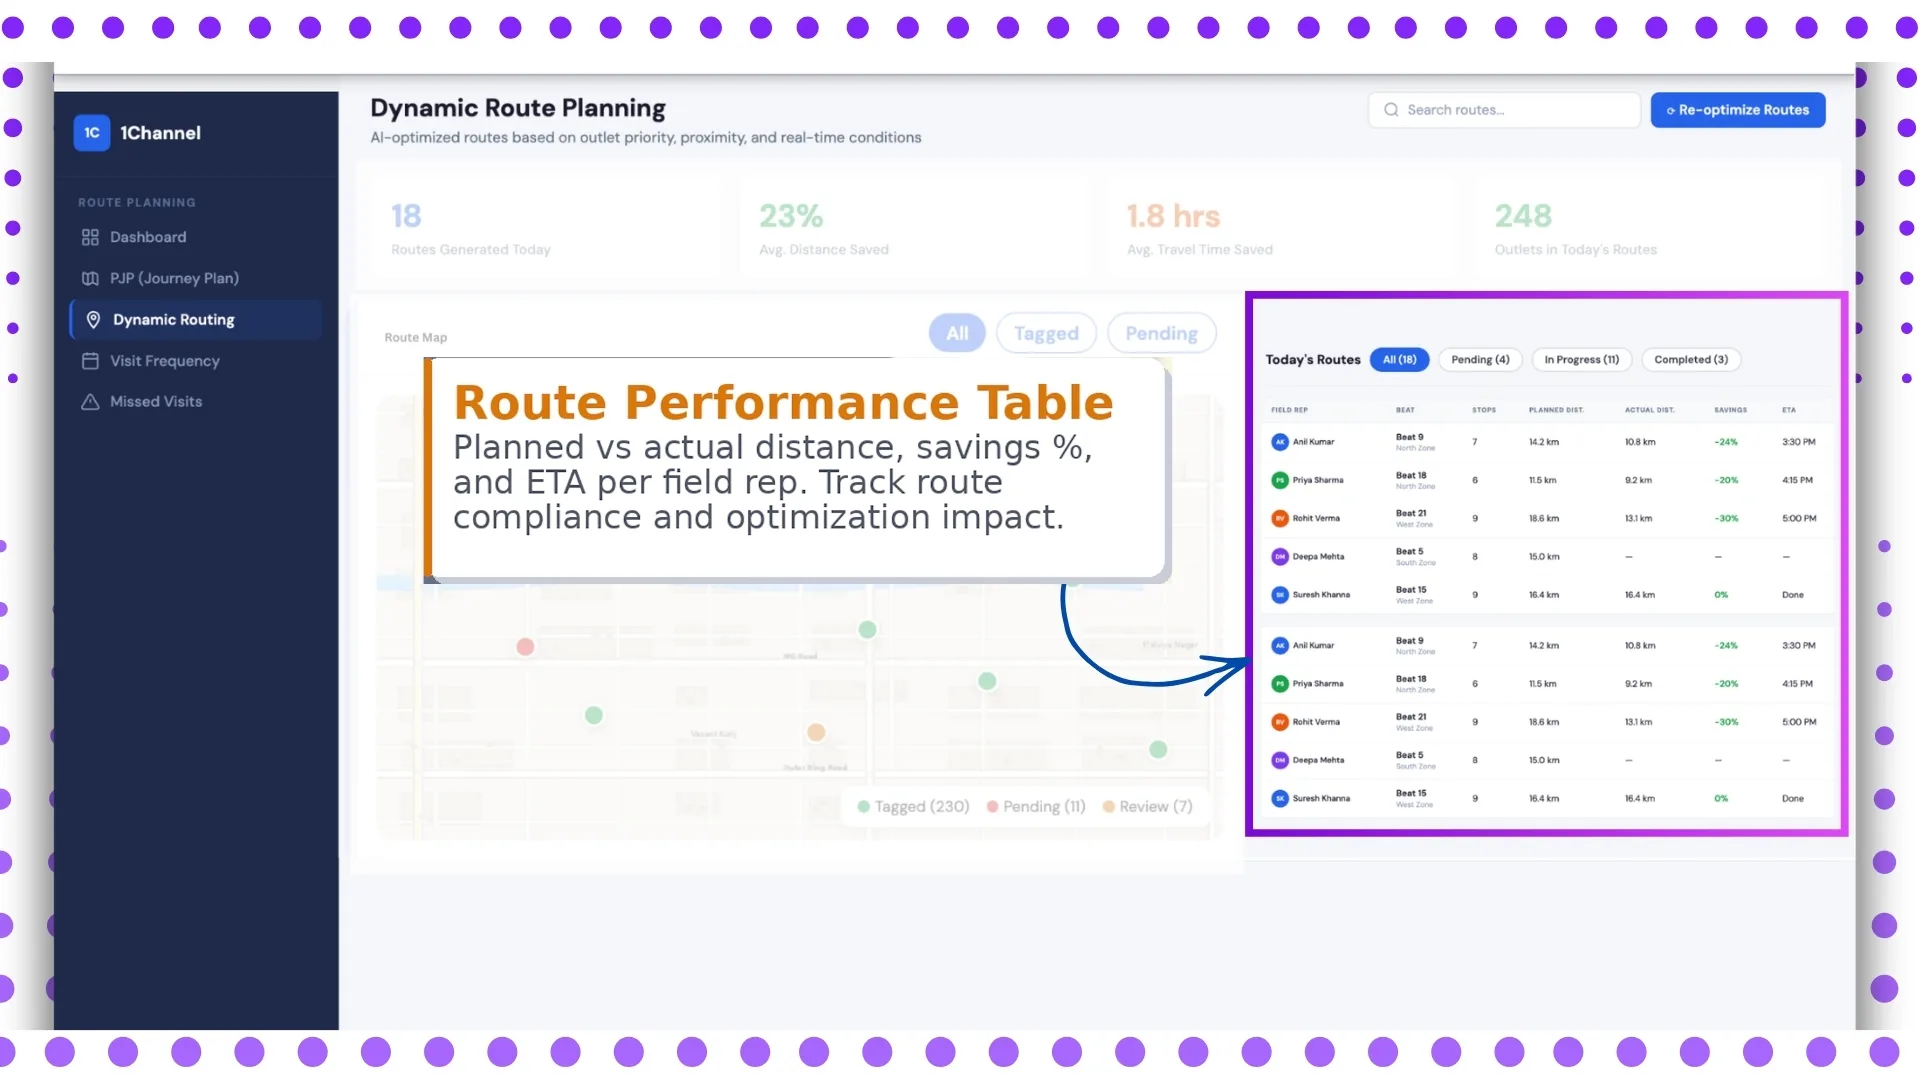
End-of-day breakdown by rep: planned versus actual, time-in-store, time-on-route, and exception list. Reads as the daily review summary the rep and supervisor go through together.
7. Visit Frequency
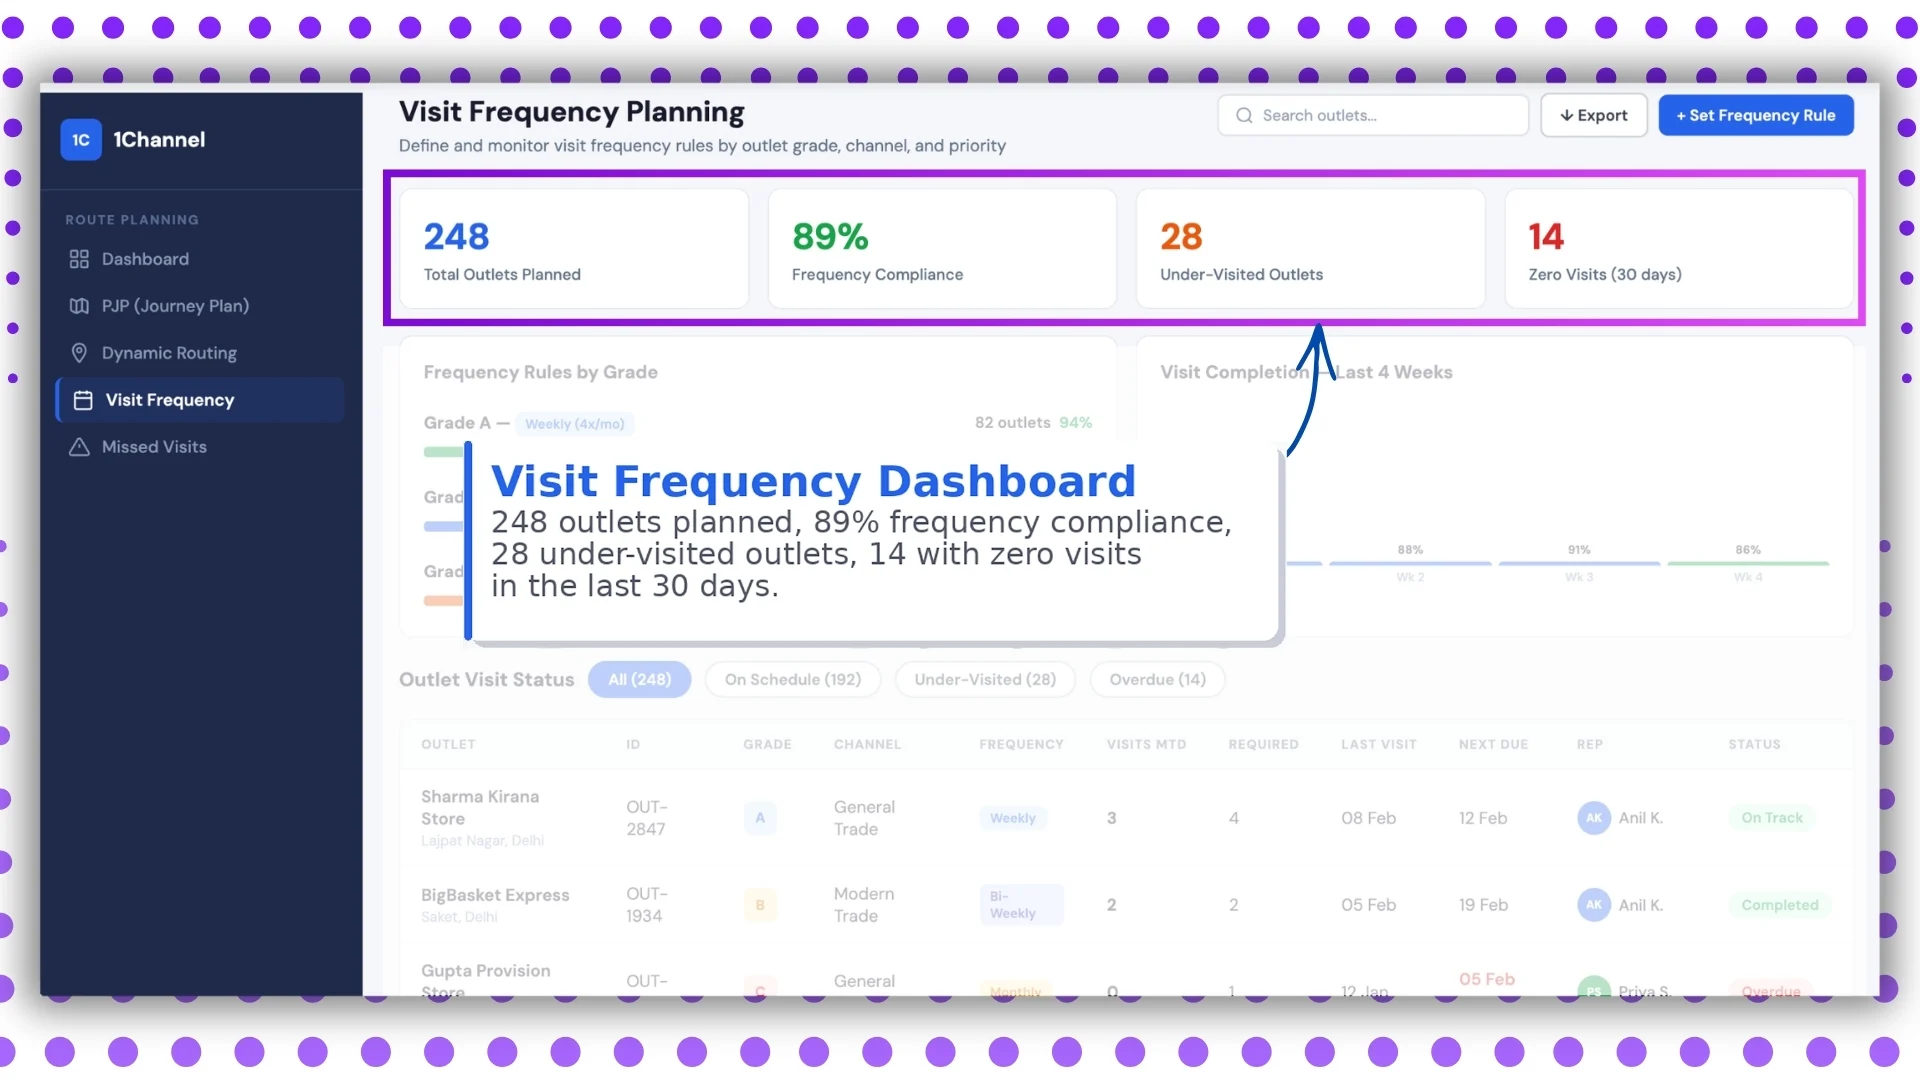
How often each outlet was visited against the plan. Surfaces outlets that have been over-visited as well as ones that have slipped off the cycle.
8. Grade-Based Frequency Rules
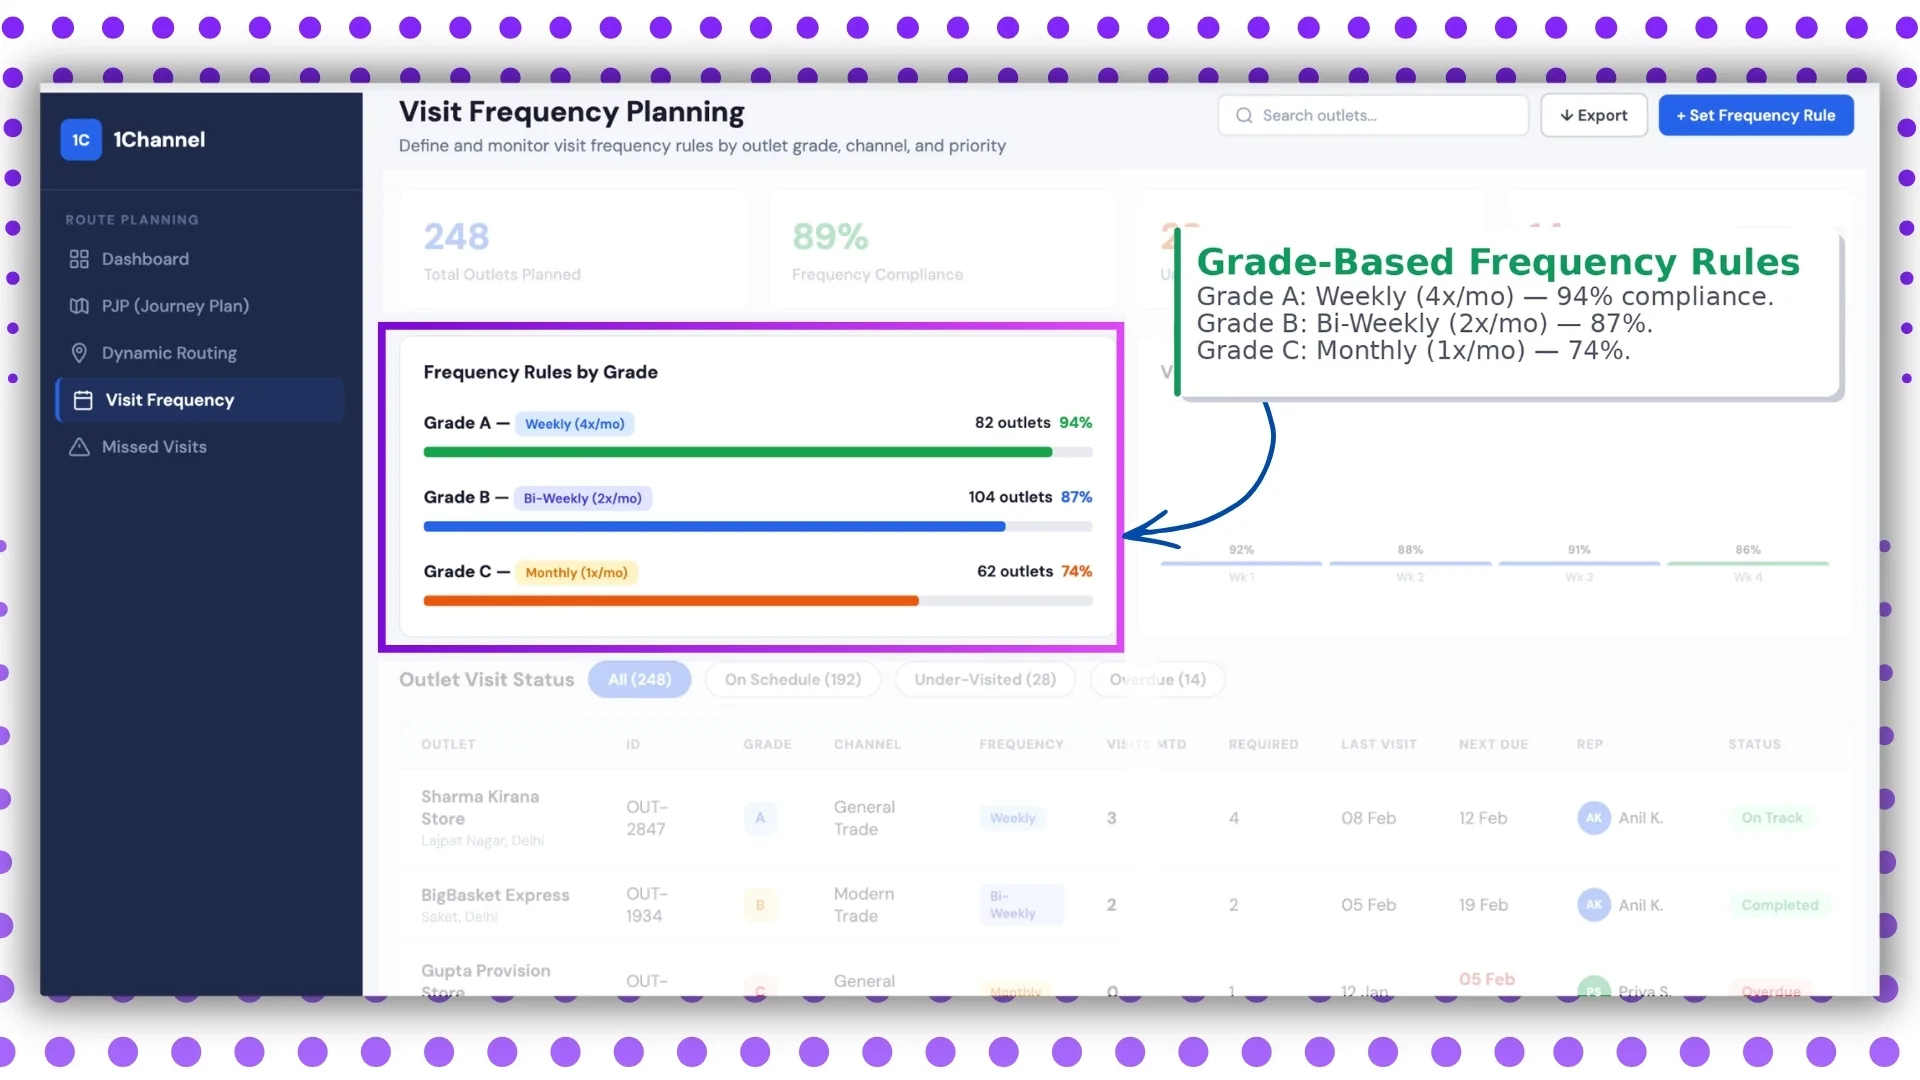
A-grade outlets visit weekly, B-grade fortnightly, C-grade monthly. The dashboard reads compliance against these rules, not against a flat target, which is what makes the number actually fair.
9. Outlet Visit Status
Every planned outlet, with its current status: visited today, scheduled, missed, or recovered. Reads as a checklist the supervisor can act on without leaving the dashboard.
10. Missed Visit Recovery
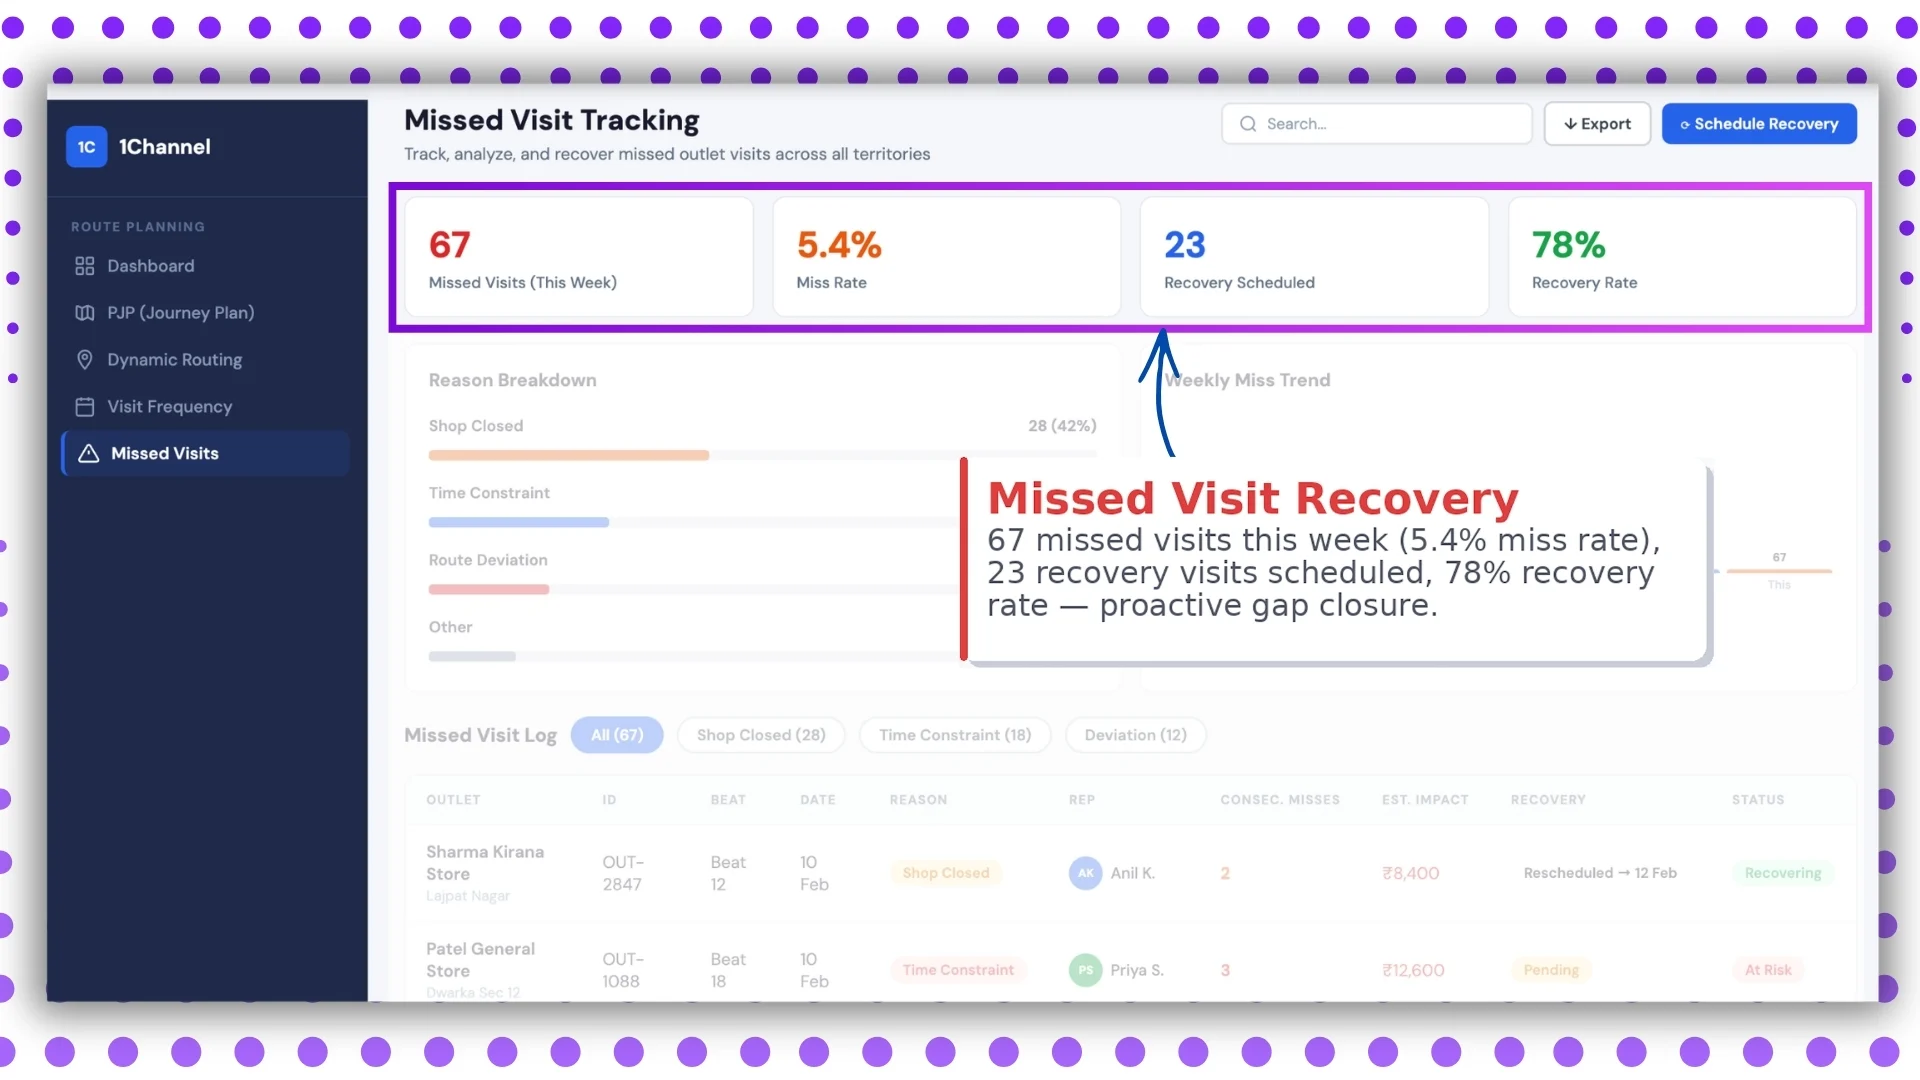
Of the visits that missed in the planned week, how many got recovered in the rescheduled slot. Recovery rate is a leading indicator of the next quarter's compliance.
11. Missed Visit Reasons and Trend
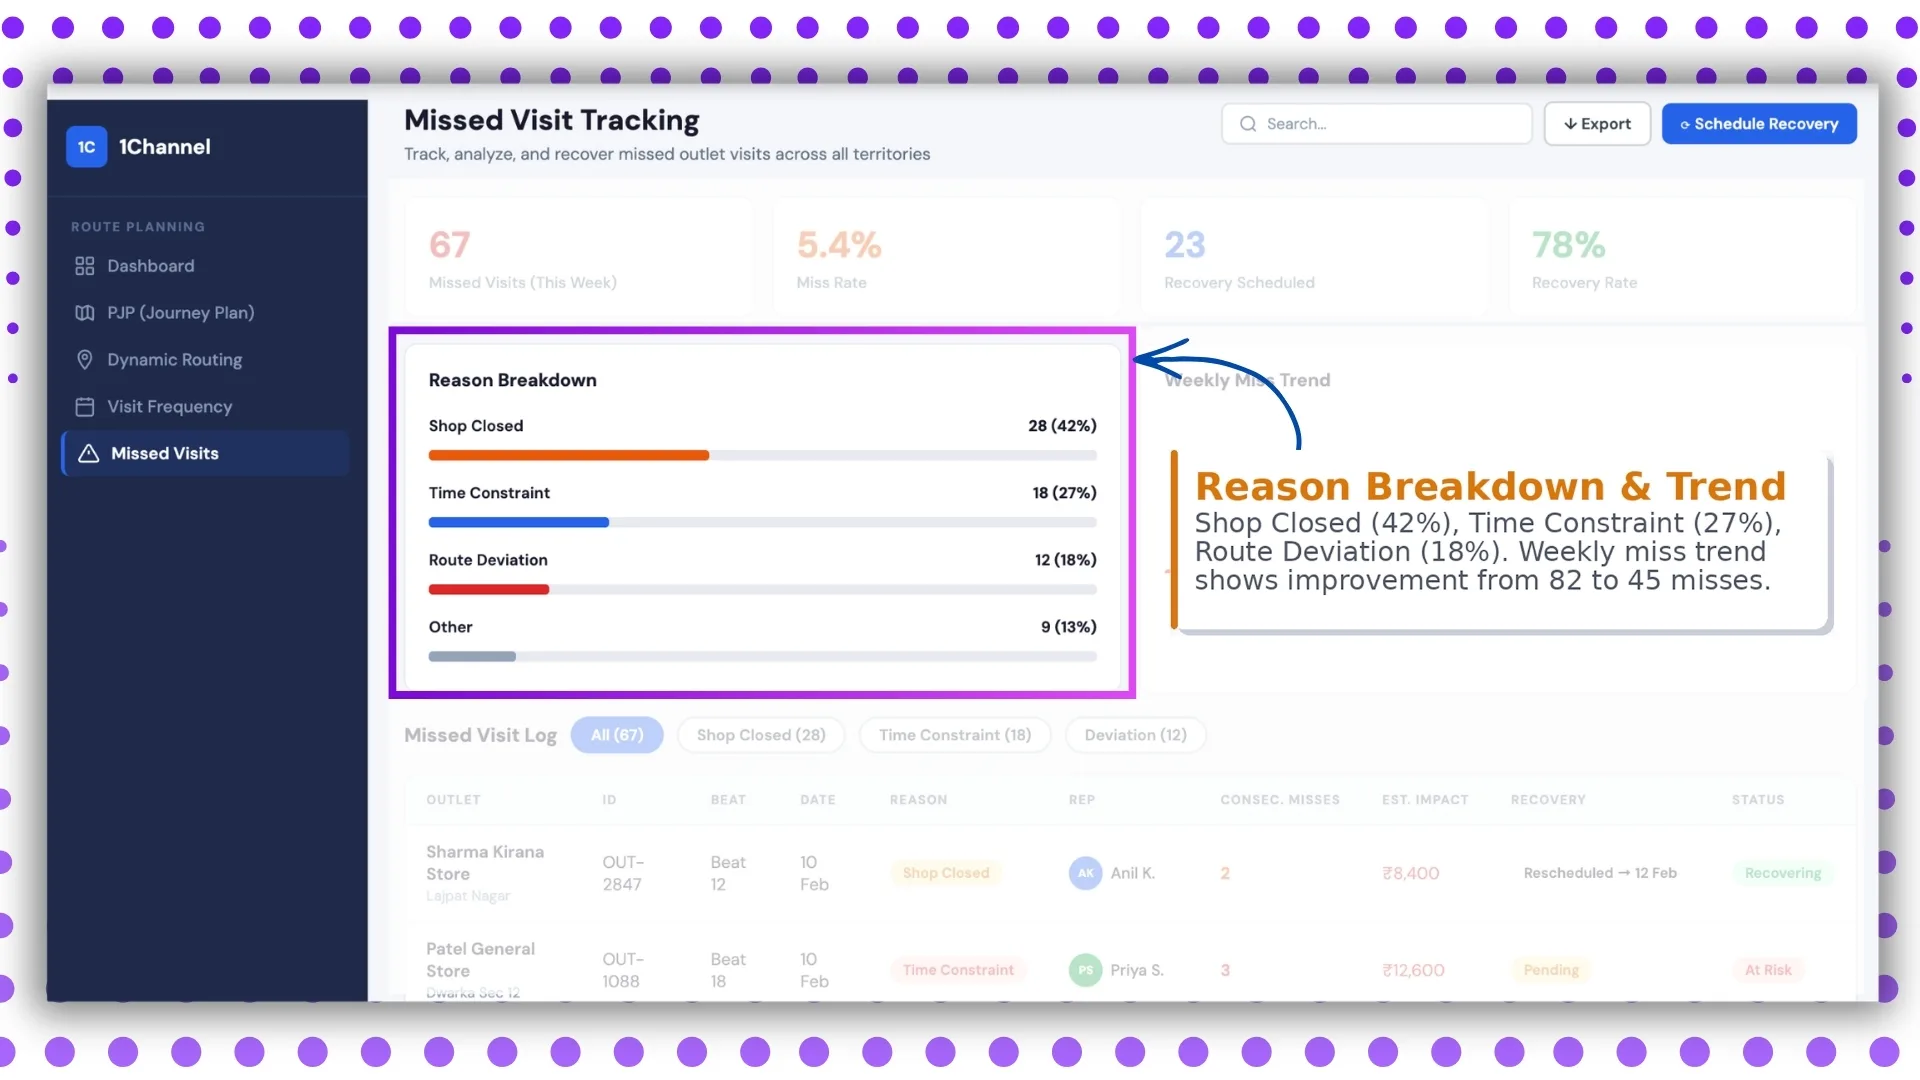
Why visits got missed: outlet closed, partner unavailable, weather, network, rep diverted. The trend over weeks tells the leader which reasons are structural and which are noise.
12. Missed Visit Log
The named list of missed visits, with outlet code, rep, reason, and recovery status. Reads as the action item list for the next operations meeting.
How 1Channel Runs Beat Compliance for Malaysian Field Teams
1Channel runs beat compliance through its cloud Sales Force Automation, route planning, and analytics modules. Every visit posts to the central ledger automatically, and the compliance number recomputes in real time across the twelve screens above.
1Channel's AI engine surfaces patterns the leader might miss. A region whose compliance is concentrated in two reps, a grade where misses are stacking up, a beat that has fallen below recovery target two weeks running: all flagged as soft alerts.
Configuration runs through the admin console. New beats, grade rules, reason categories, and dashboard layouts go live the same day they are approved, with an automated dry-run preview against the last 30 days of field data.
Explore Cloud Route Planning Software
1Channel's cloud route planning platform anchors beat compliance with AI route optimisation and automated dashboard rollups.
Explore Route Planning Software →Key Takeaways for Beat Compliance Discipline
Four points to carry into the next field operations review:
- Read compliance against the grade rules, not against a flat target. A 70 percent compliance number means very different things for A-grade outlets versus C-grade ones. The dashboard separates the two for a reason.
- Watch recovery rate as the leading indicator. A region with a falling compliance number but a strong recovery rate is in better shape than one with a flat compliance number and zero recovery. The recovery signal arrives early.
- Filter by reason before filtering by rep. Most rep-level coaching conversations are downstream of structural issues. Reading the reasons-and-trend screen first prevents wrong-headed coaching.
- Use the live route map for the meeting, not for surveillance. The map's value sits in the operational visibility it gives during the day, not in micromanaging the rep after the fact.