Yesterday's sales dashboard was a static morning report. The team walked in, read the previous day's numbers, and built the day's plan against data that was already 12 hours old.
Today's dashboard updates in real time. The morning numbers are the morning numbers. The afternoon numbers shift the conversation by lunch, and the rep on the field reads the same view the leader at headquarters reads.
Real-time dashboards changed the cadence of sales operations from daily to live. The eight screens below cover what each one shows and why each one matters in the live cadence.
Table of Contents
What 'Real Time' Means for a Sales Dashboard
A real-time sales dashboard refreshes against the underlying ledger as events land. A rep marks an attendance check-in: the attendance tile updates. A partner places an order: the sales tile updates. A territory closes for the day: the territory comparison reshuffles.
On the cloud platform, the refresh happens automatically as the data streams in. The dashboard reader does not refresh manually; they just trust the screen they are looking at to be current.
Eight Live Screens Worth Reading Every Cycle
Each screen below answers a different question. Together they form the read-out the leader walks through every morning before the operations meeting.
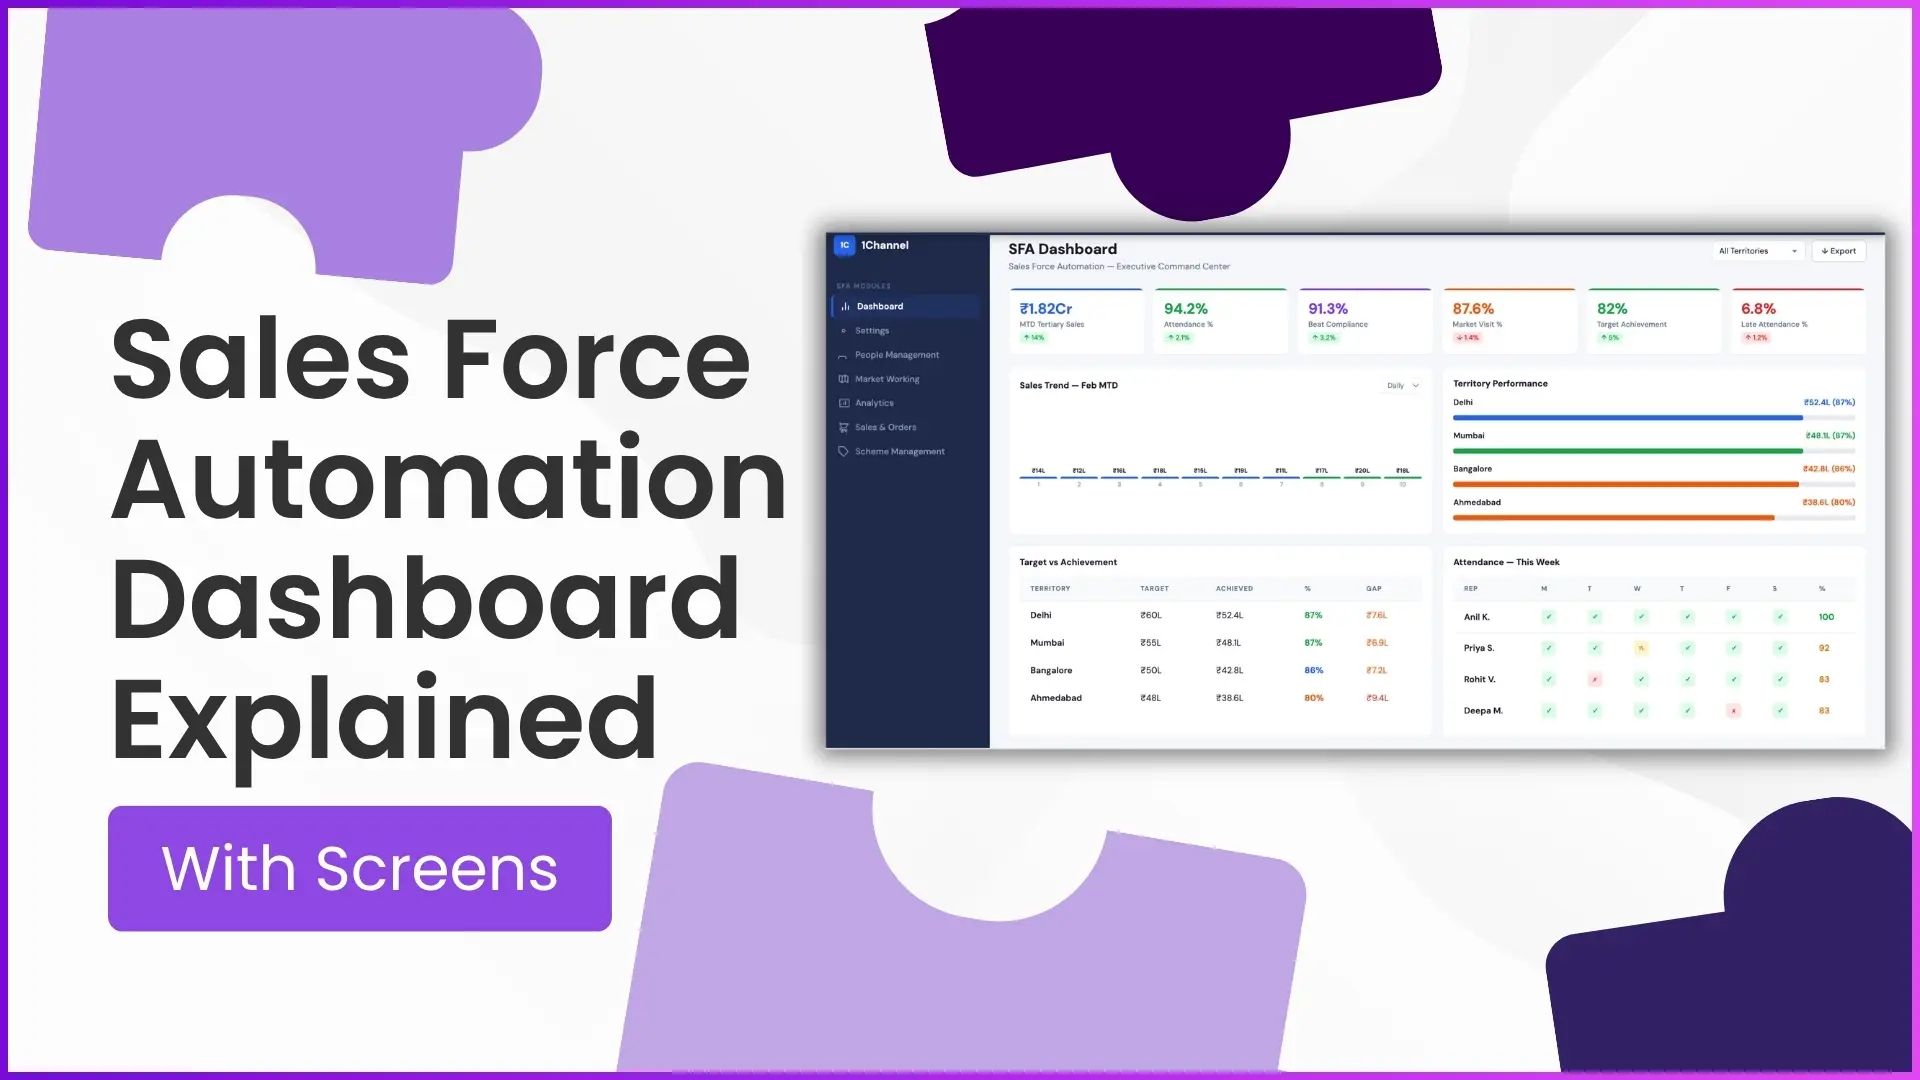
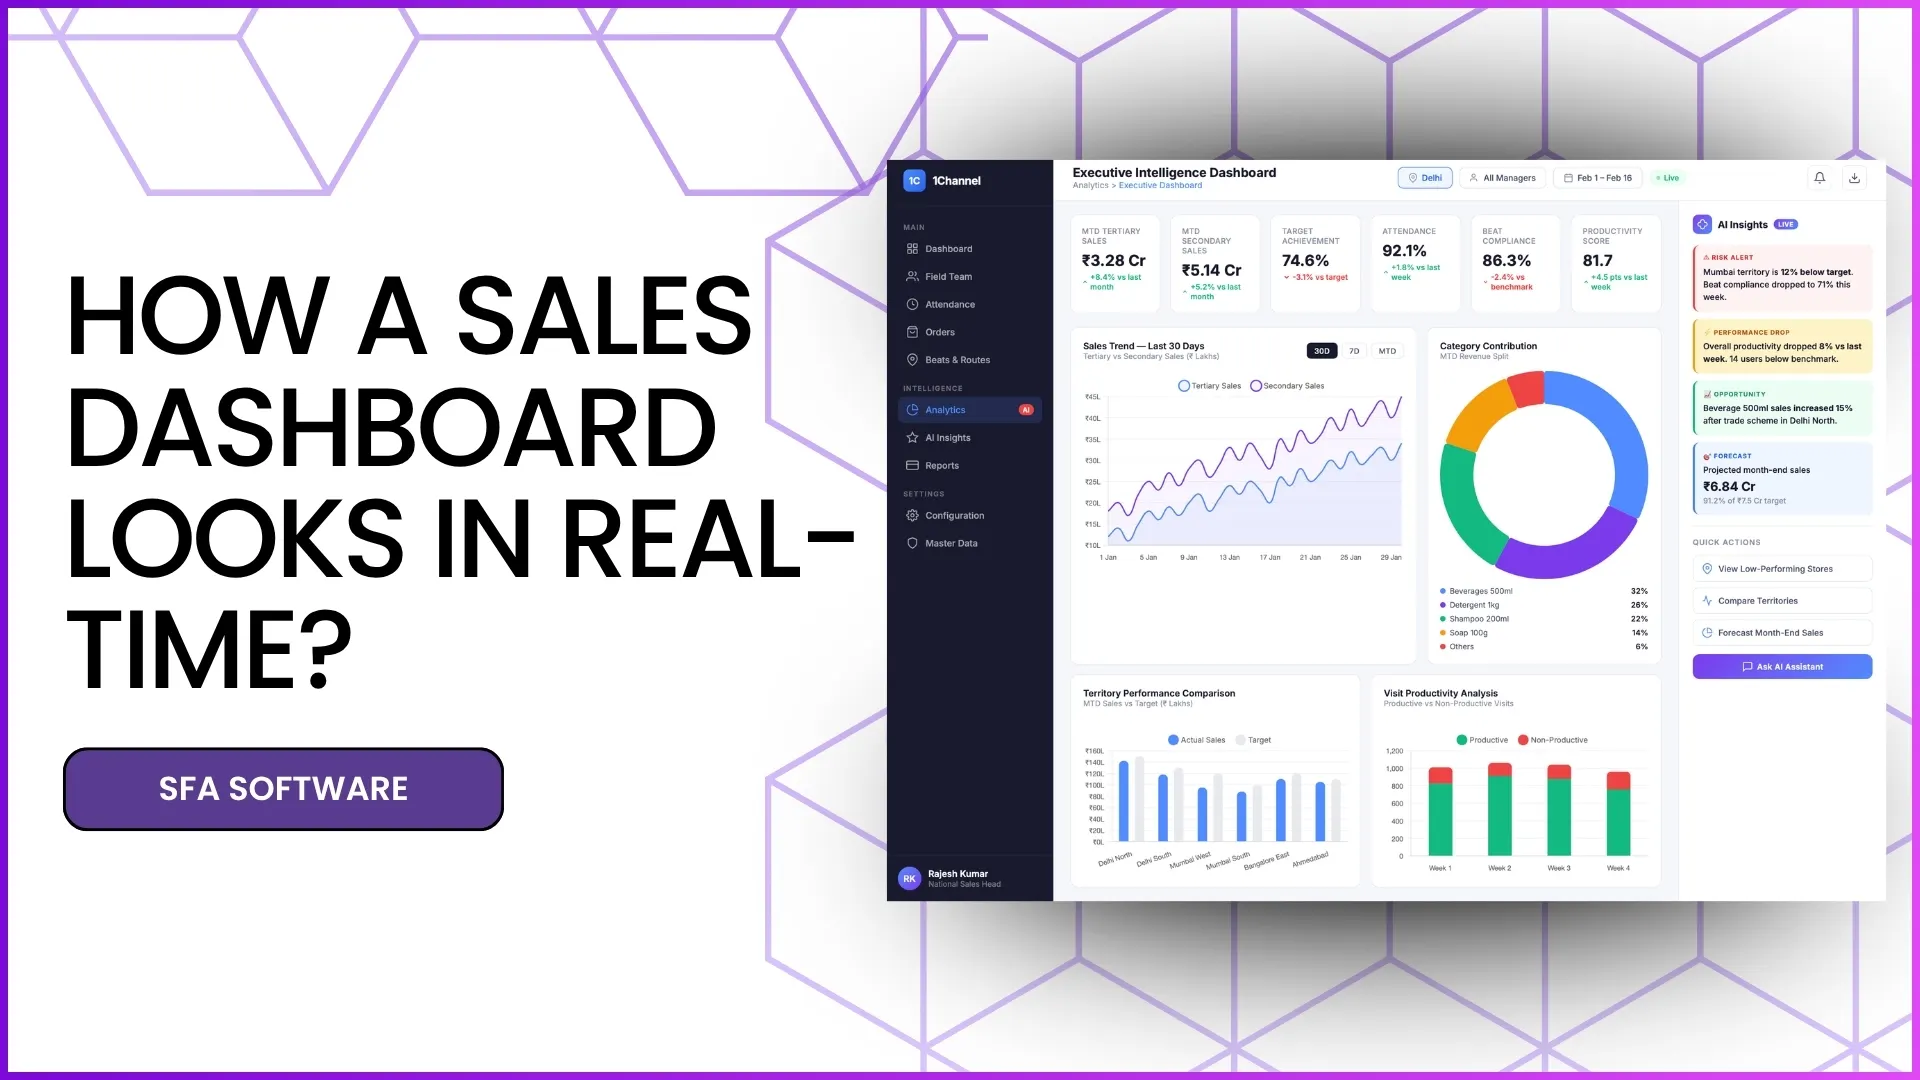
Executive KPI Command Centre
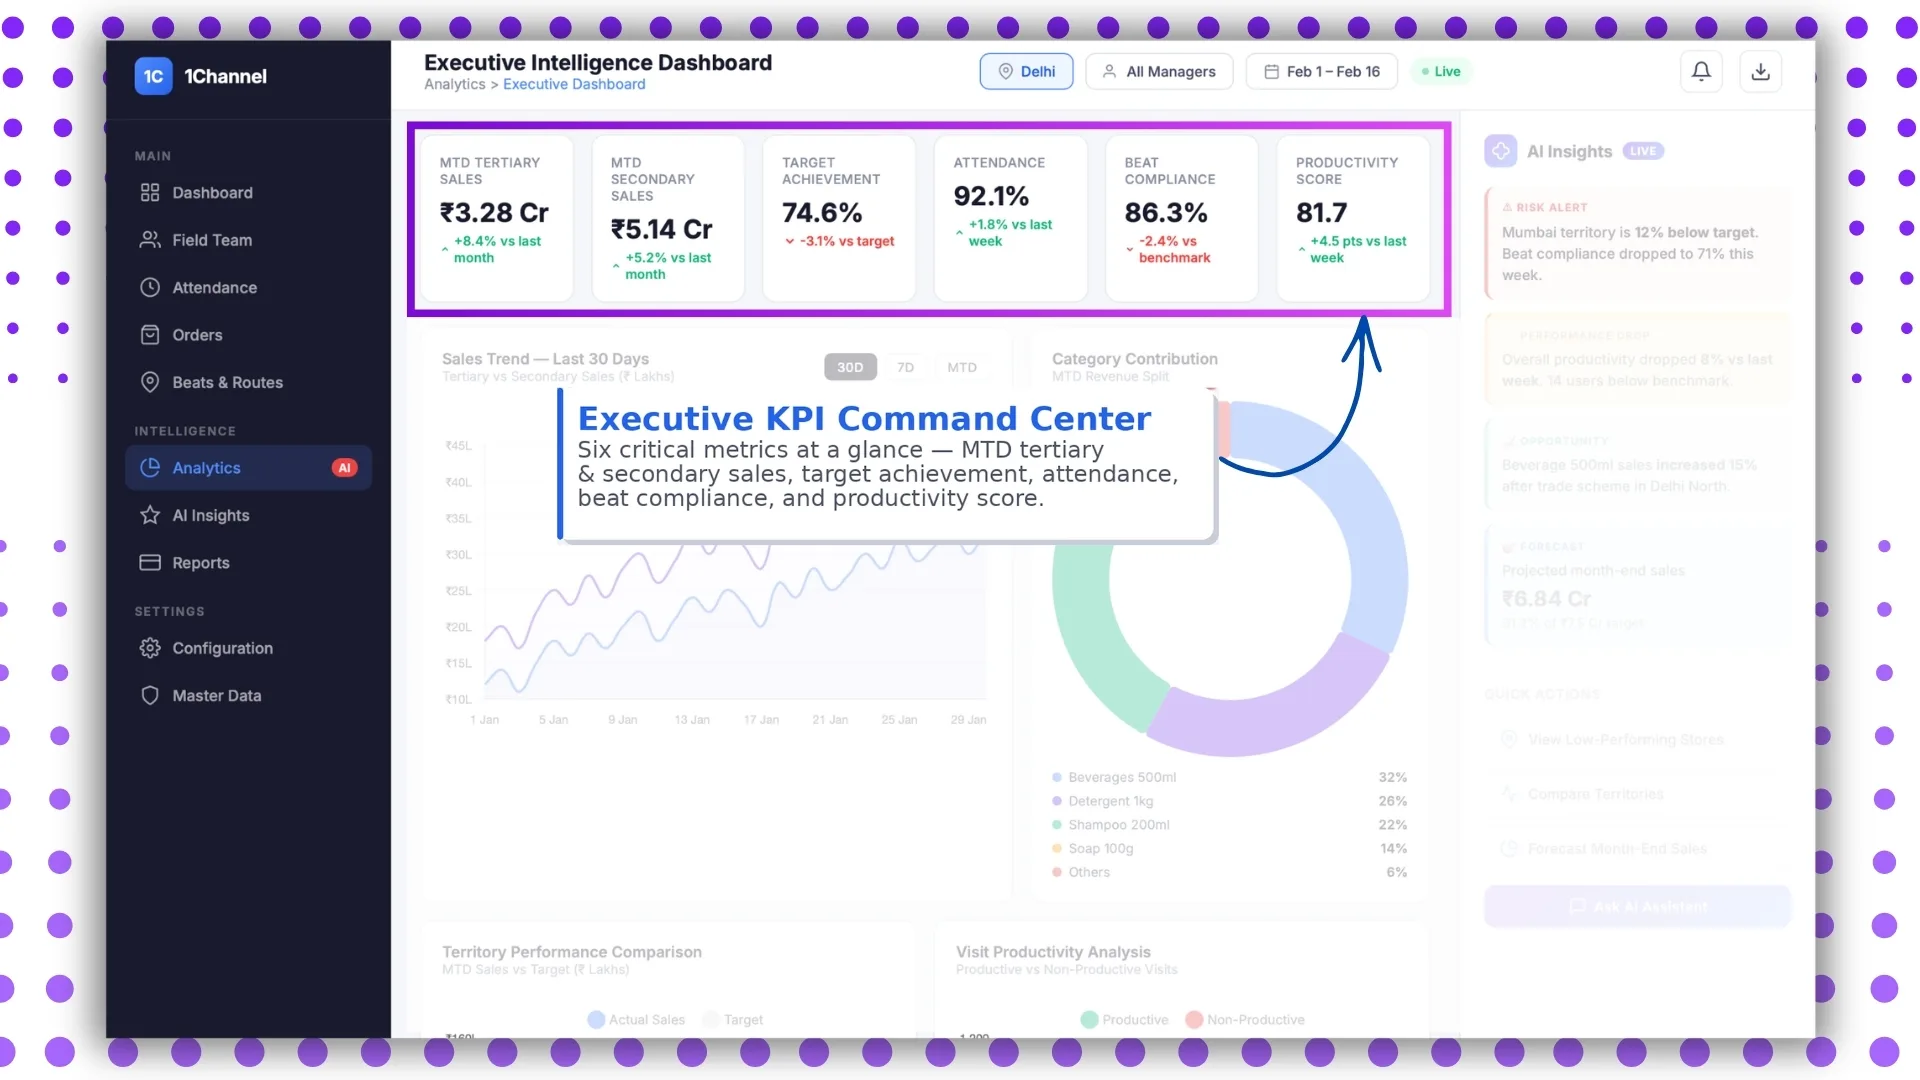
The top-level tile shows the day's KPIs against target: orders booked, visits done, attendance compliance, scheme execution. Each tile carries a colour code so the leader scans the row in 10 seconds and reads the exceptions instead of the totals.
Real-Time Attendance and Compliance
The attendance tile pairs present-day percentage with reporting-on-time share and the late-attendance count by region. The same view surfaces the names that need a coaching conversation before they slip into the defaulter category.
Sales Trend View (30D, 7D and MTD)
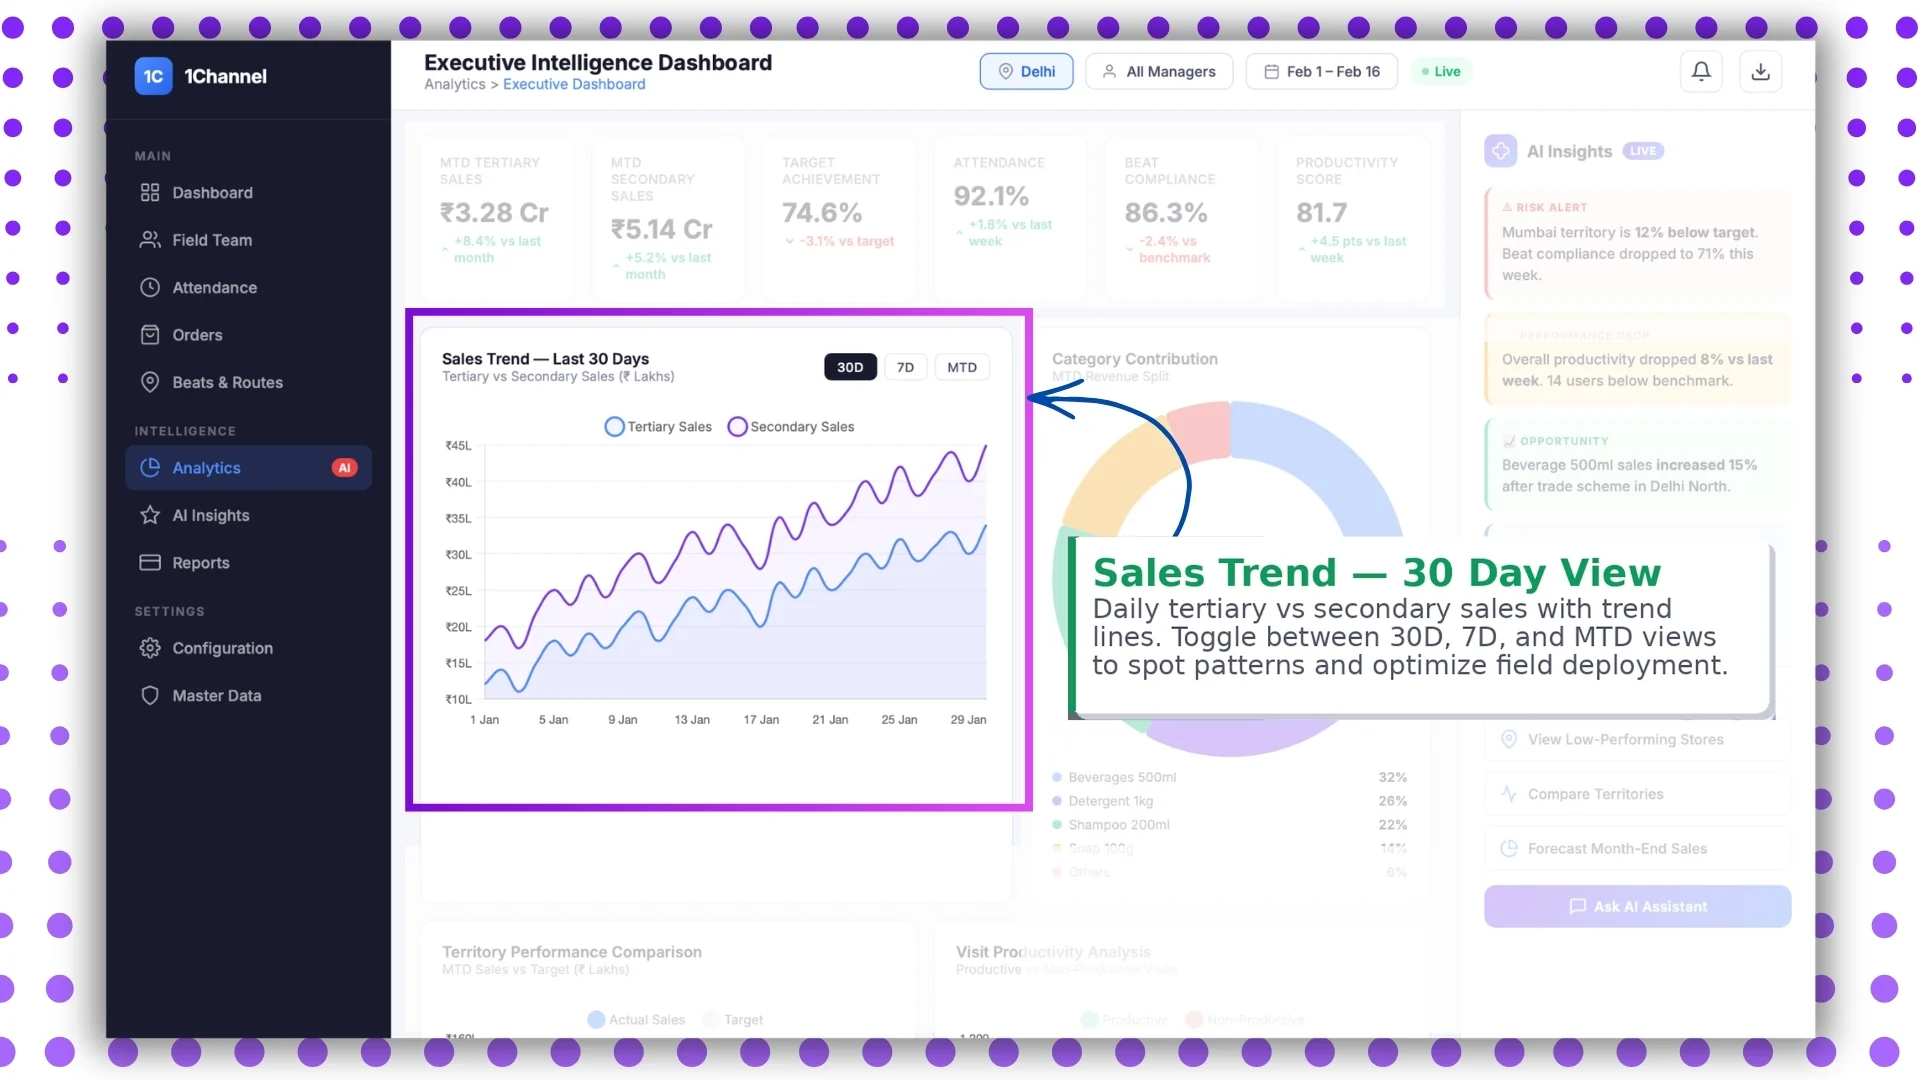
Trend lines run across three windows: the 30-day arc for the strategic read, the 7-day for the tactical read, and the MTD line for the cycle's pacing. The dashboard should let the leader toggle the windows without leaving the screen.
Category Revenue Split
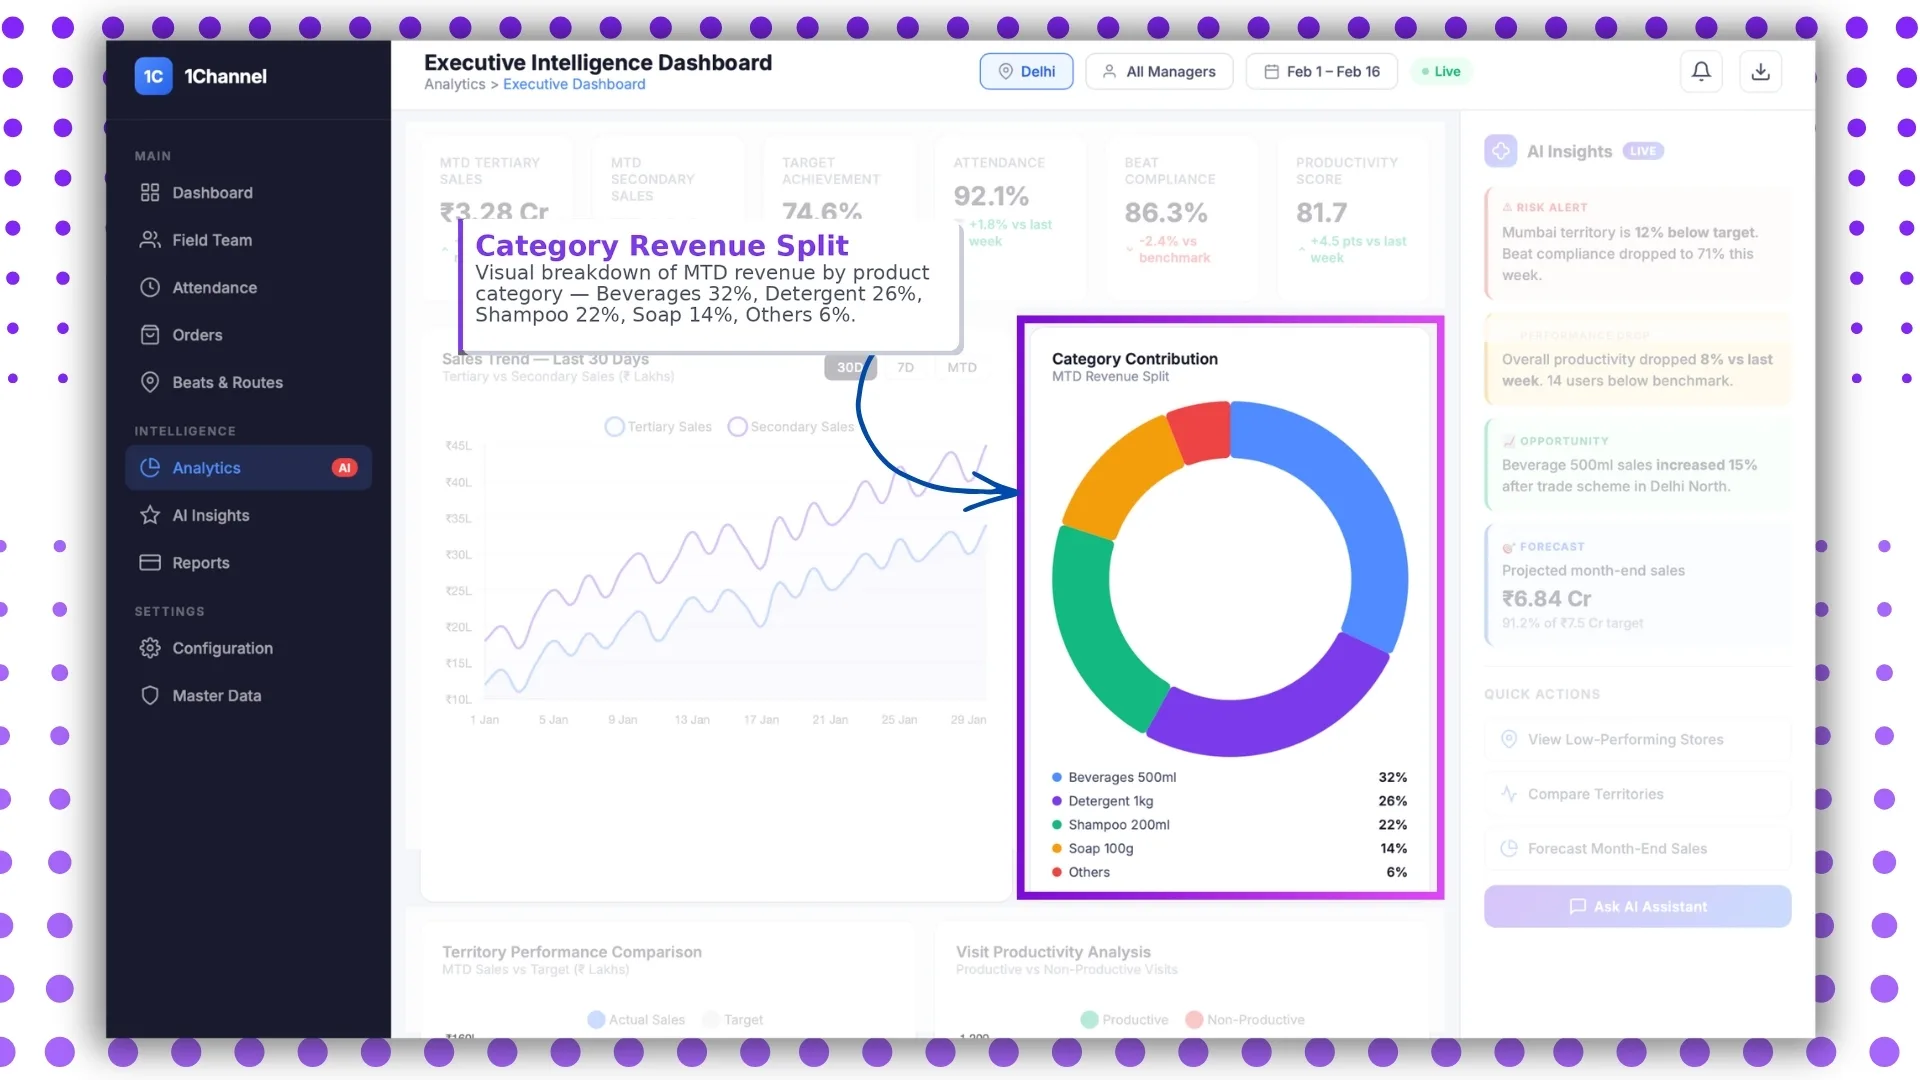
Revenue contribution by category surfaces the mix that drives the headline number. When the headline holds steady but the mix shifts toward lower-margin categories, the next conversation is about margin, not volume.
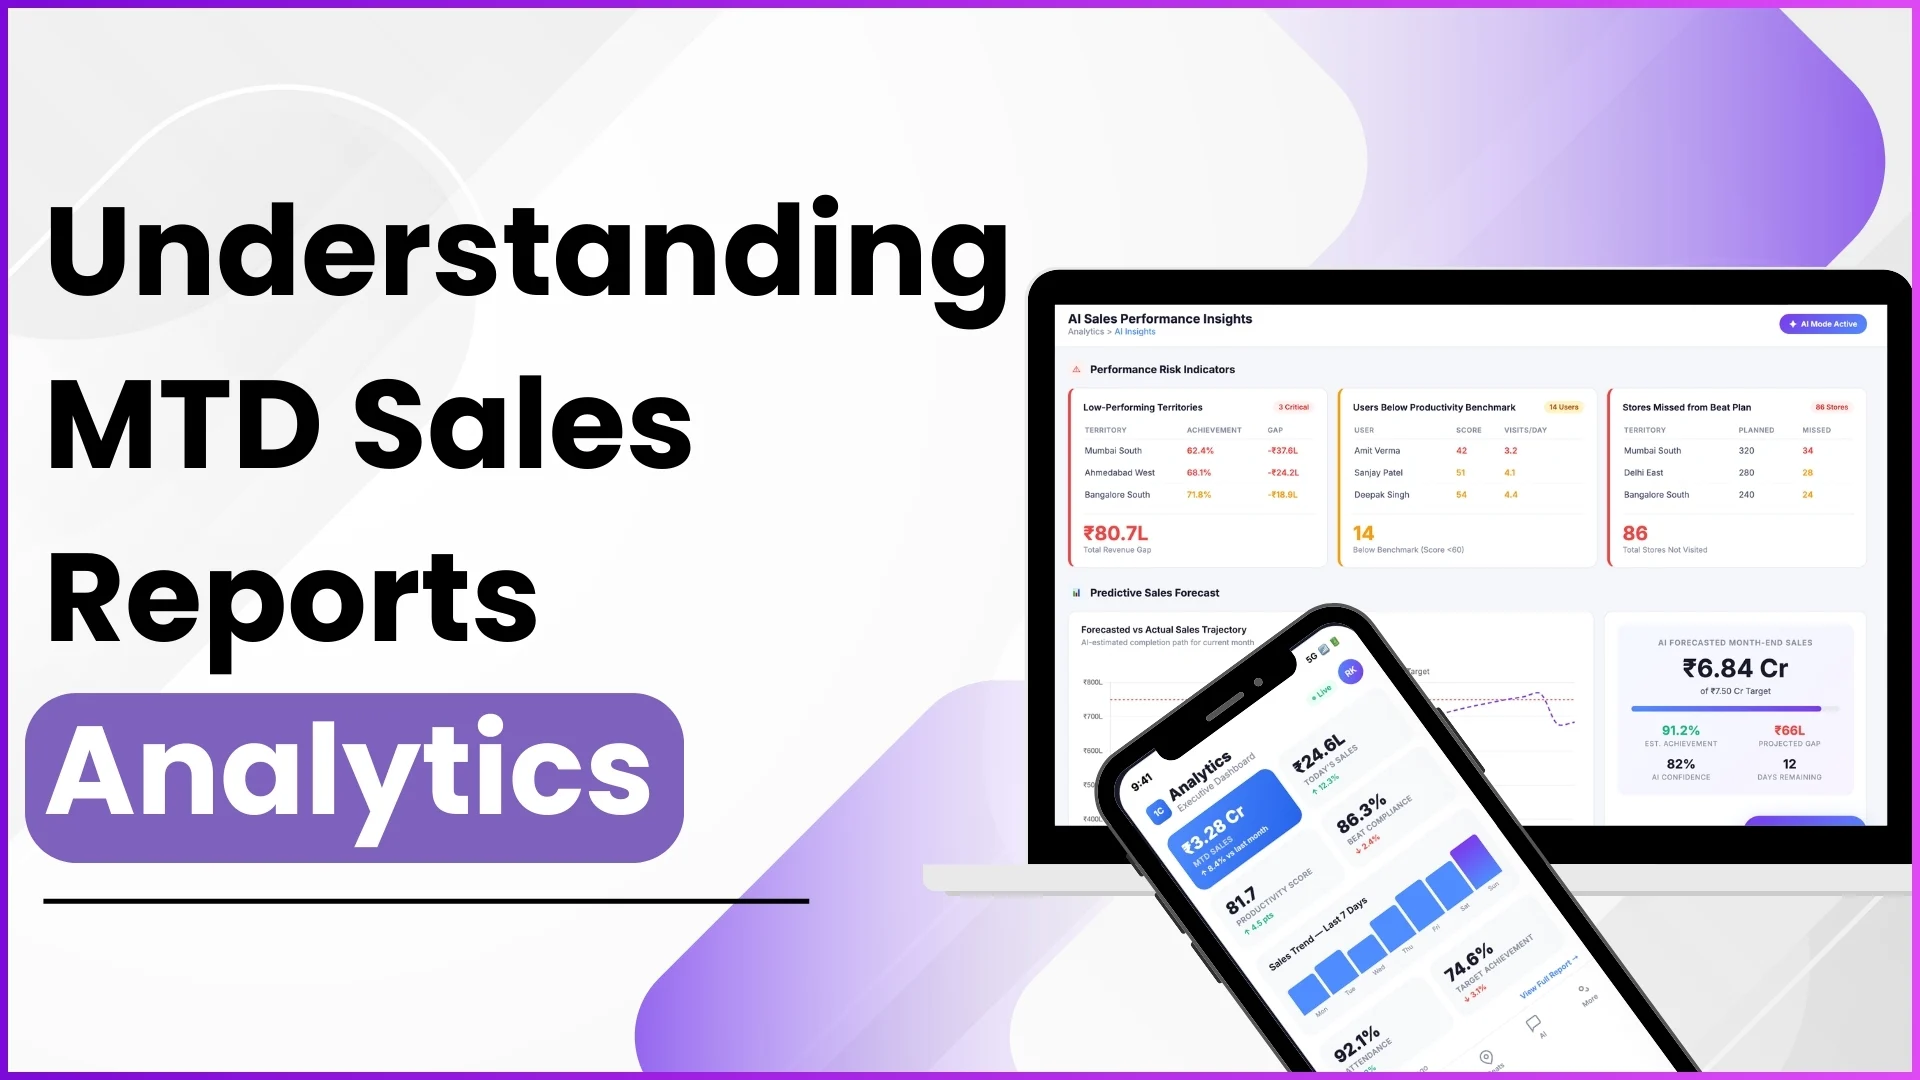
AI-Powered Live Insights
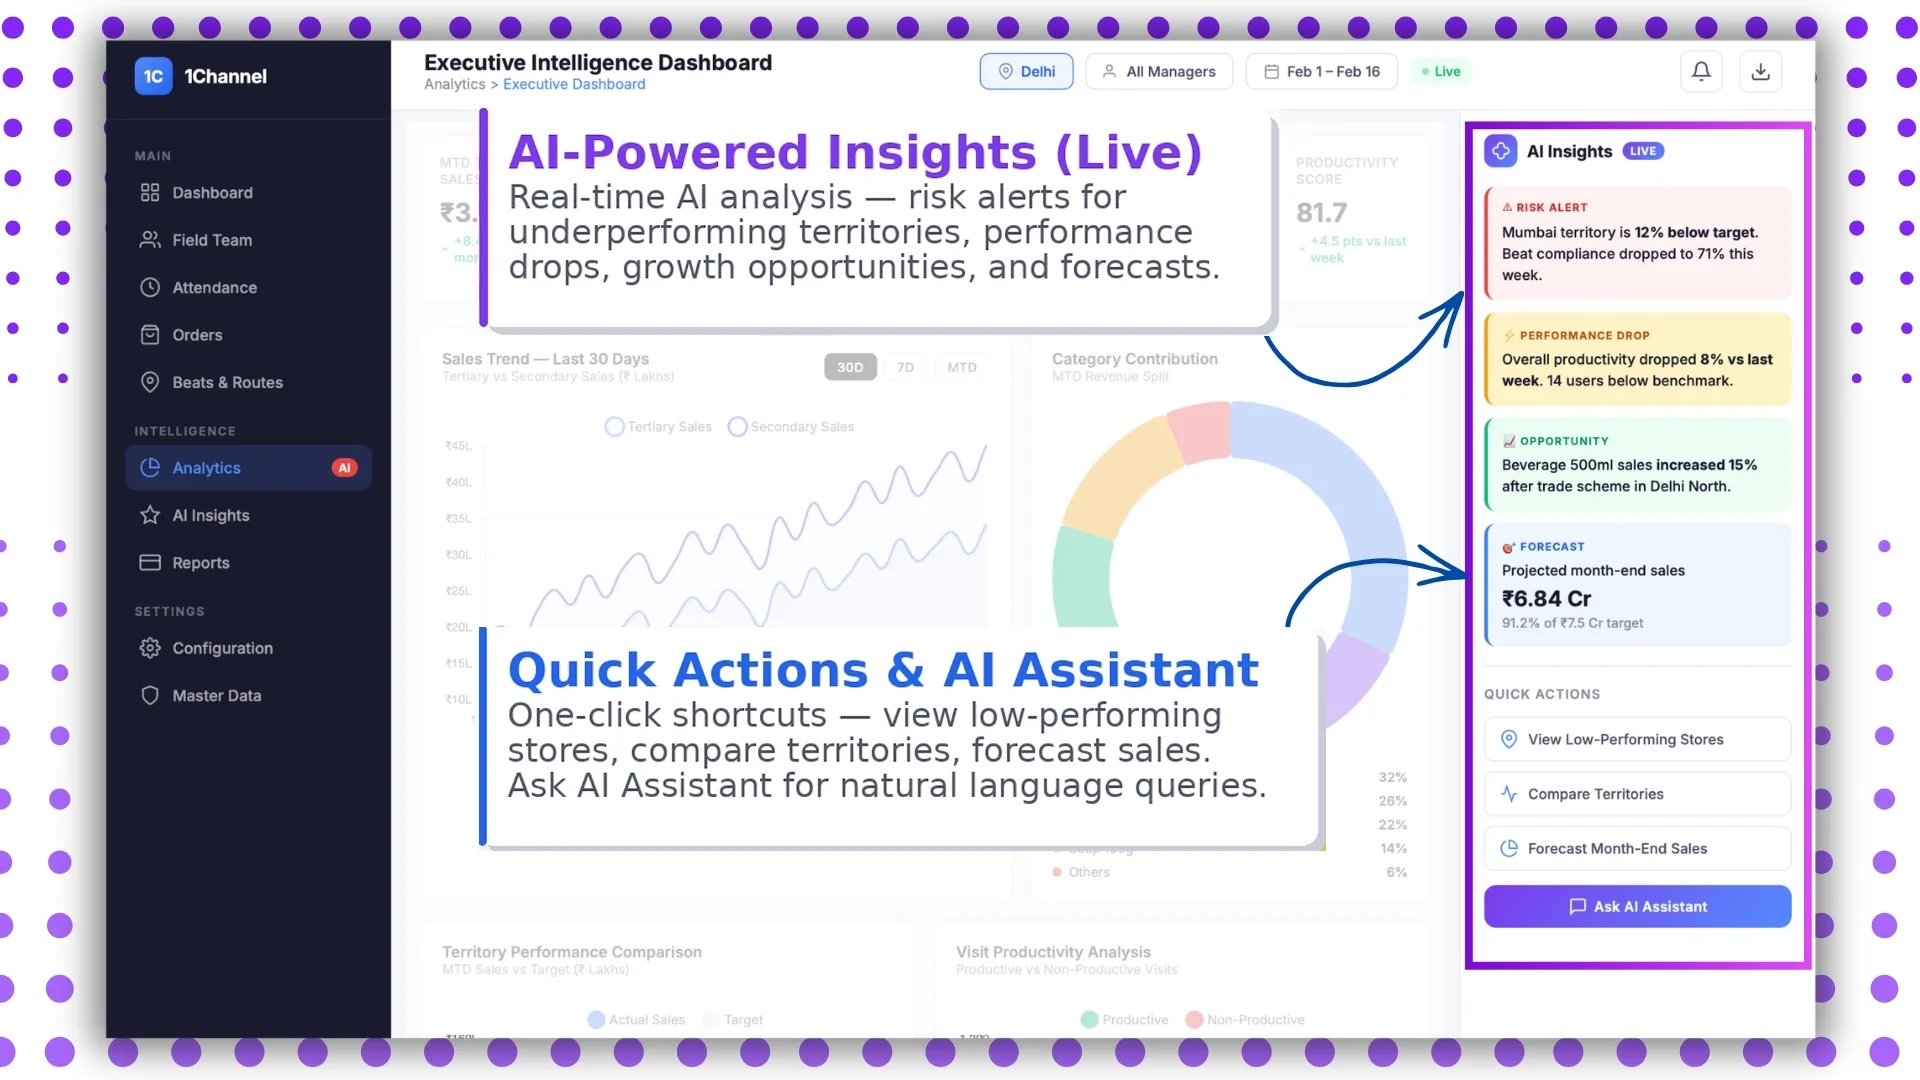
The insights panel surfaces patterns the human reader might miss in the noise. Sliding visit-quality scores, dropping order frequency, scheme adherence concentrated in one region: each shows up as a flagged tile. AI handles the pattern detection; the leader handles the response.
Territory Performance Comparison
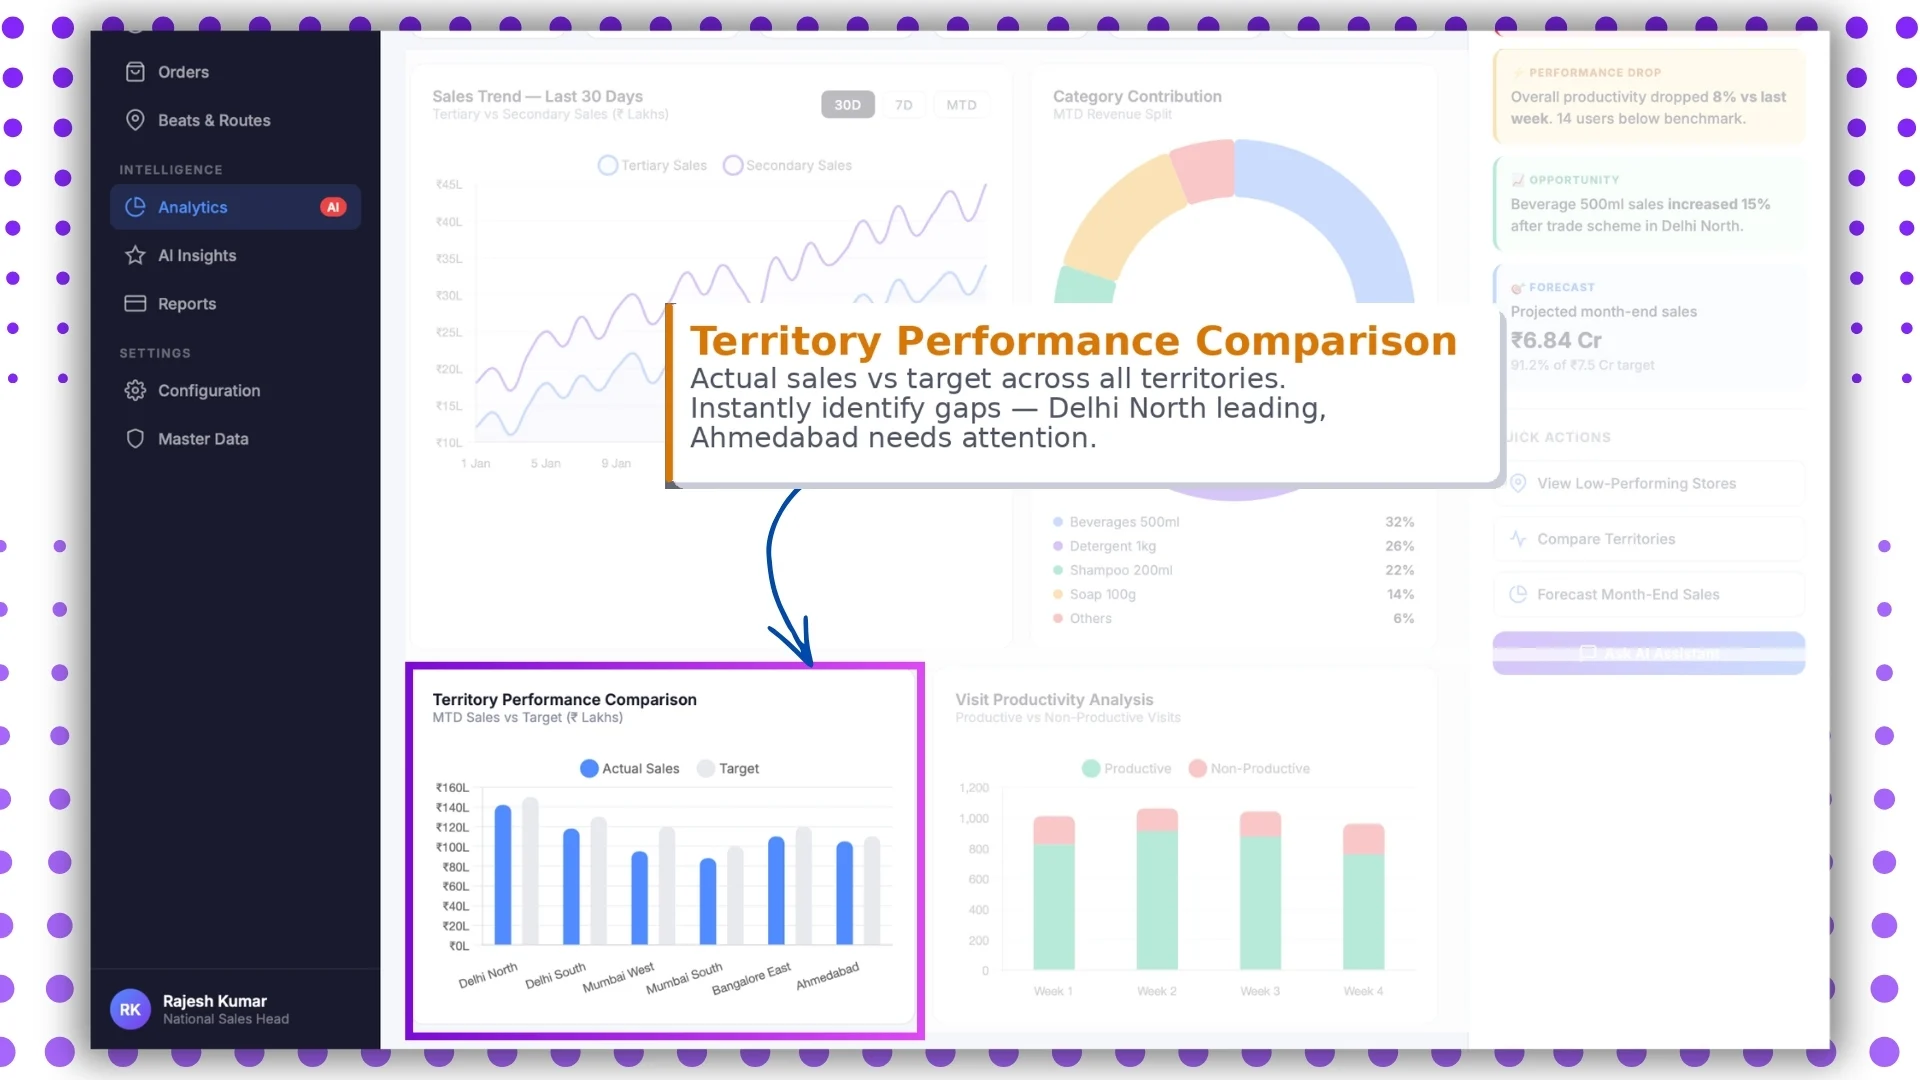
Each territory rolls up its KPIs side by side, sortable by any column. The leader compares regions without exporting to a spreadsheet, and the laggards stand out without needing to be hunted down.
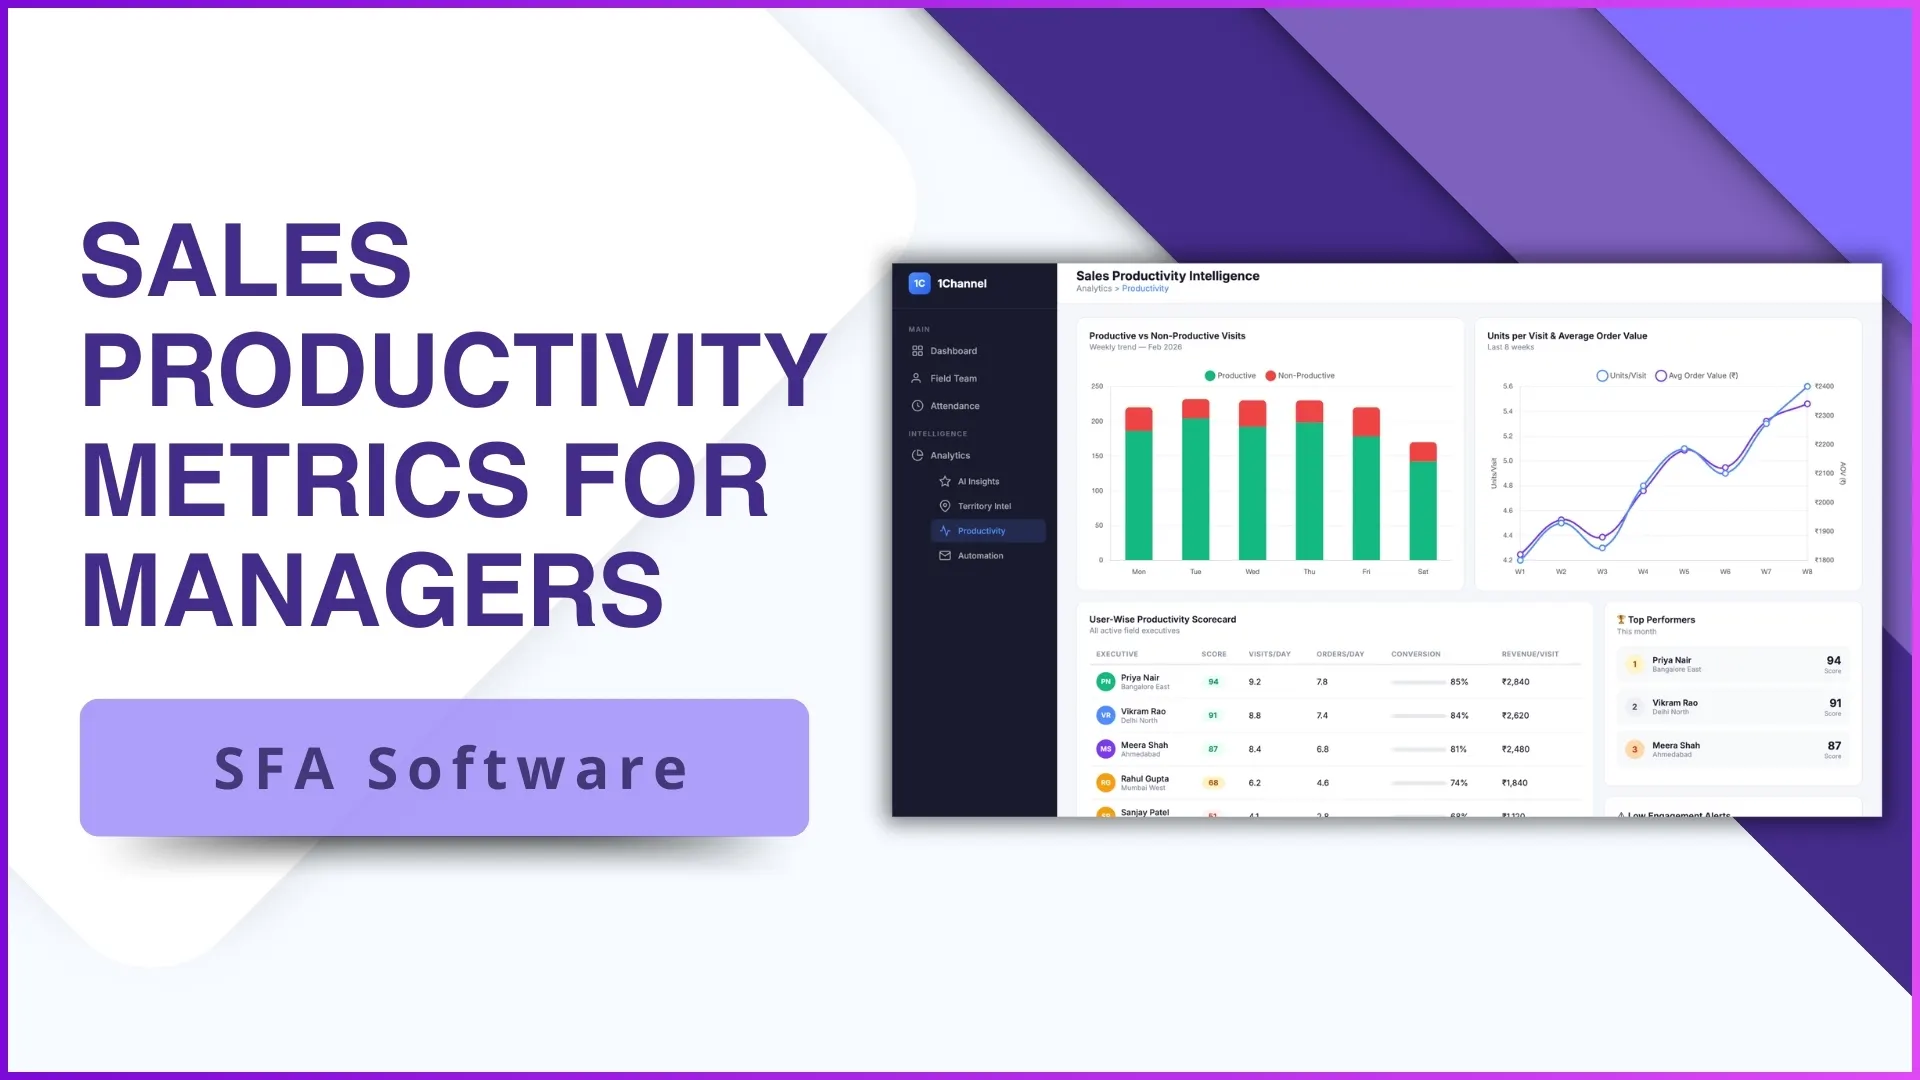
Visit Productivity Analysis
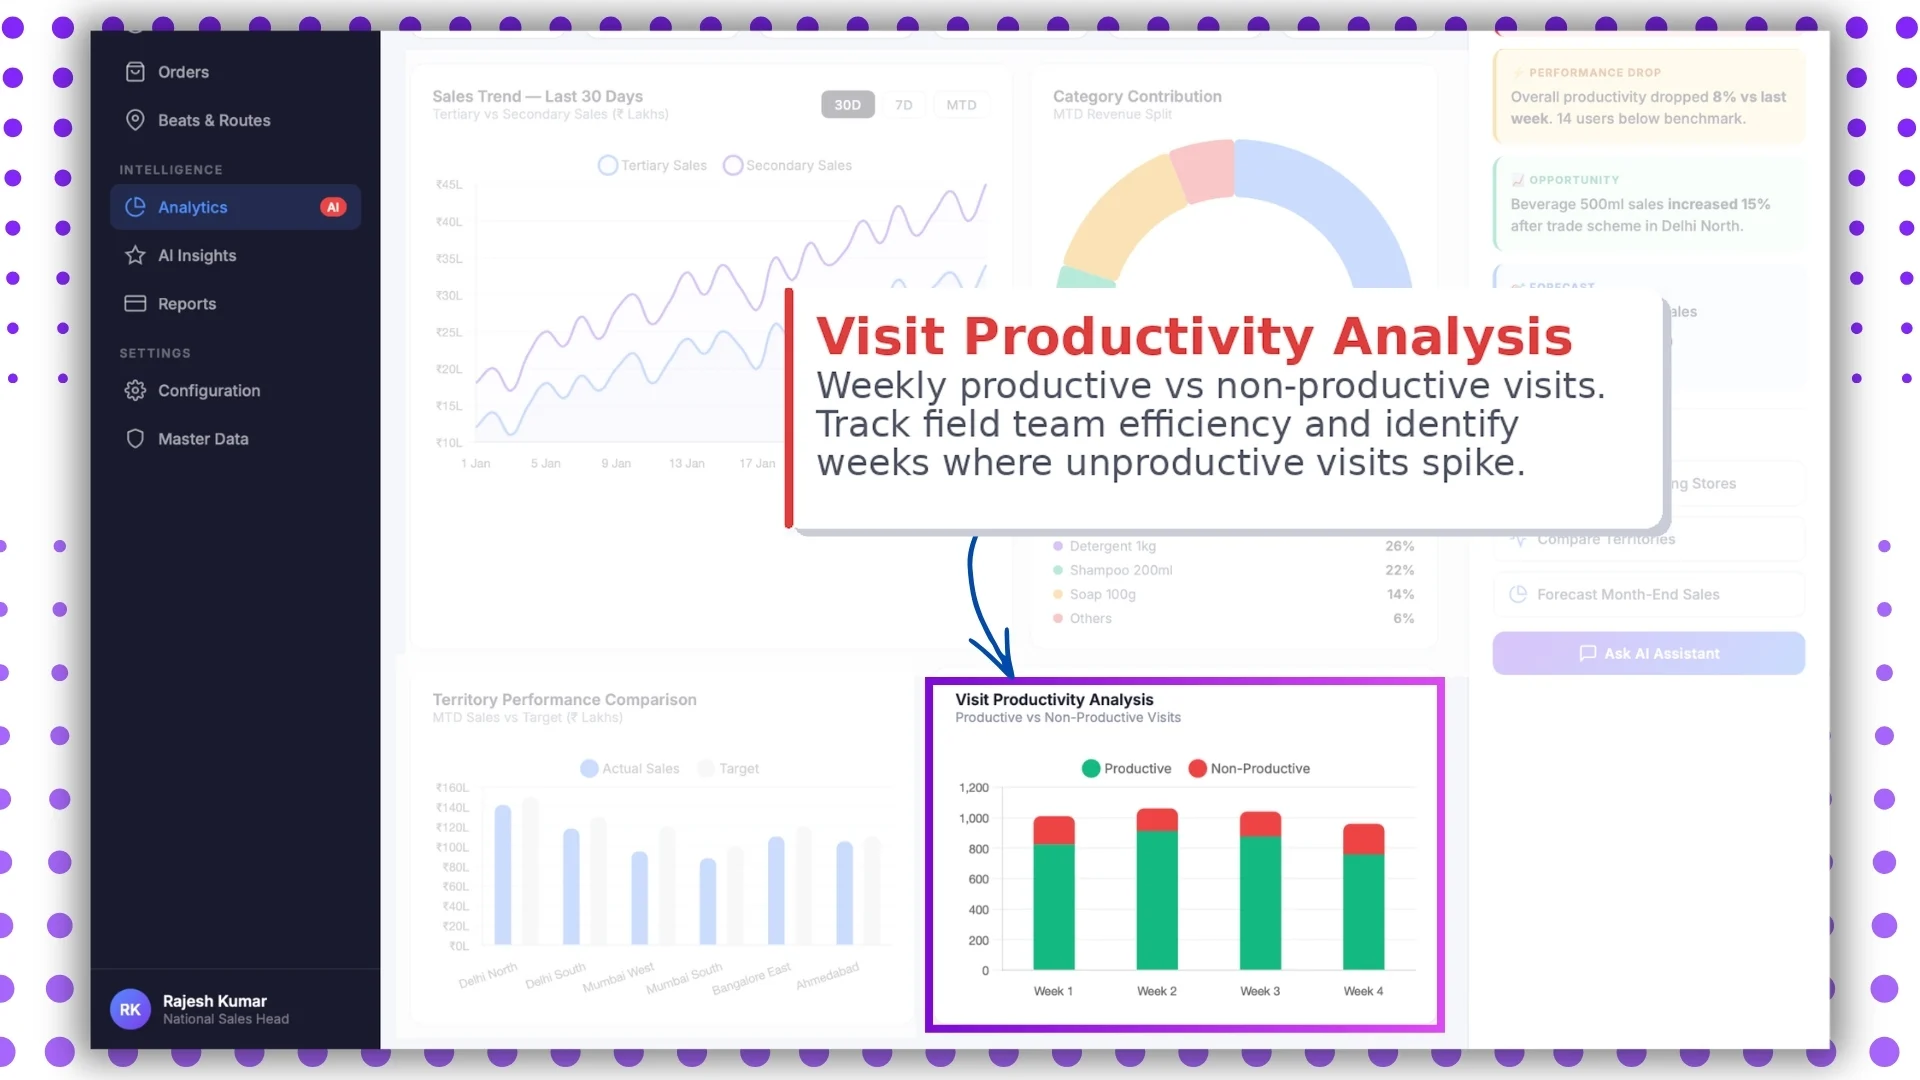
Visit-per-rep, activity-completion rate, sales-per-productive-visit, and travel-to-visit ratio surface together. Reading them as a system, not as isolated tiles, is what separates a useful productivity read from a misleading one.
Smart Filters and Live Mode
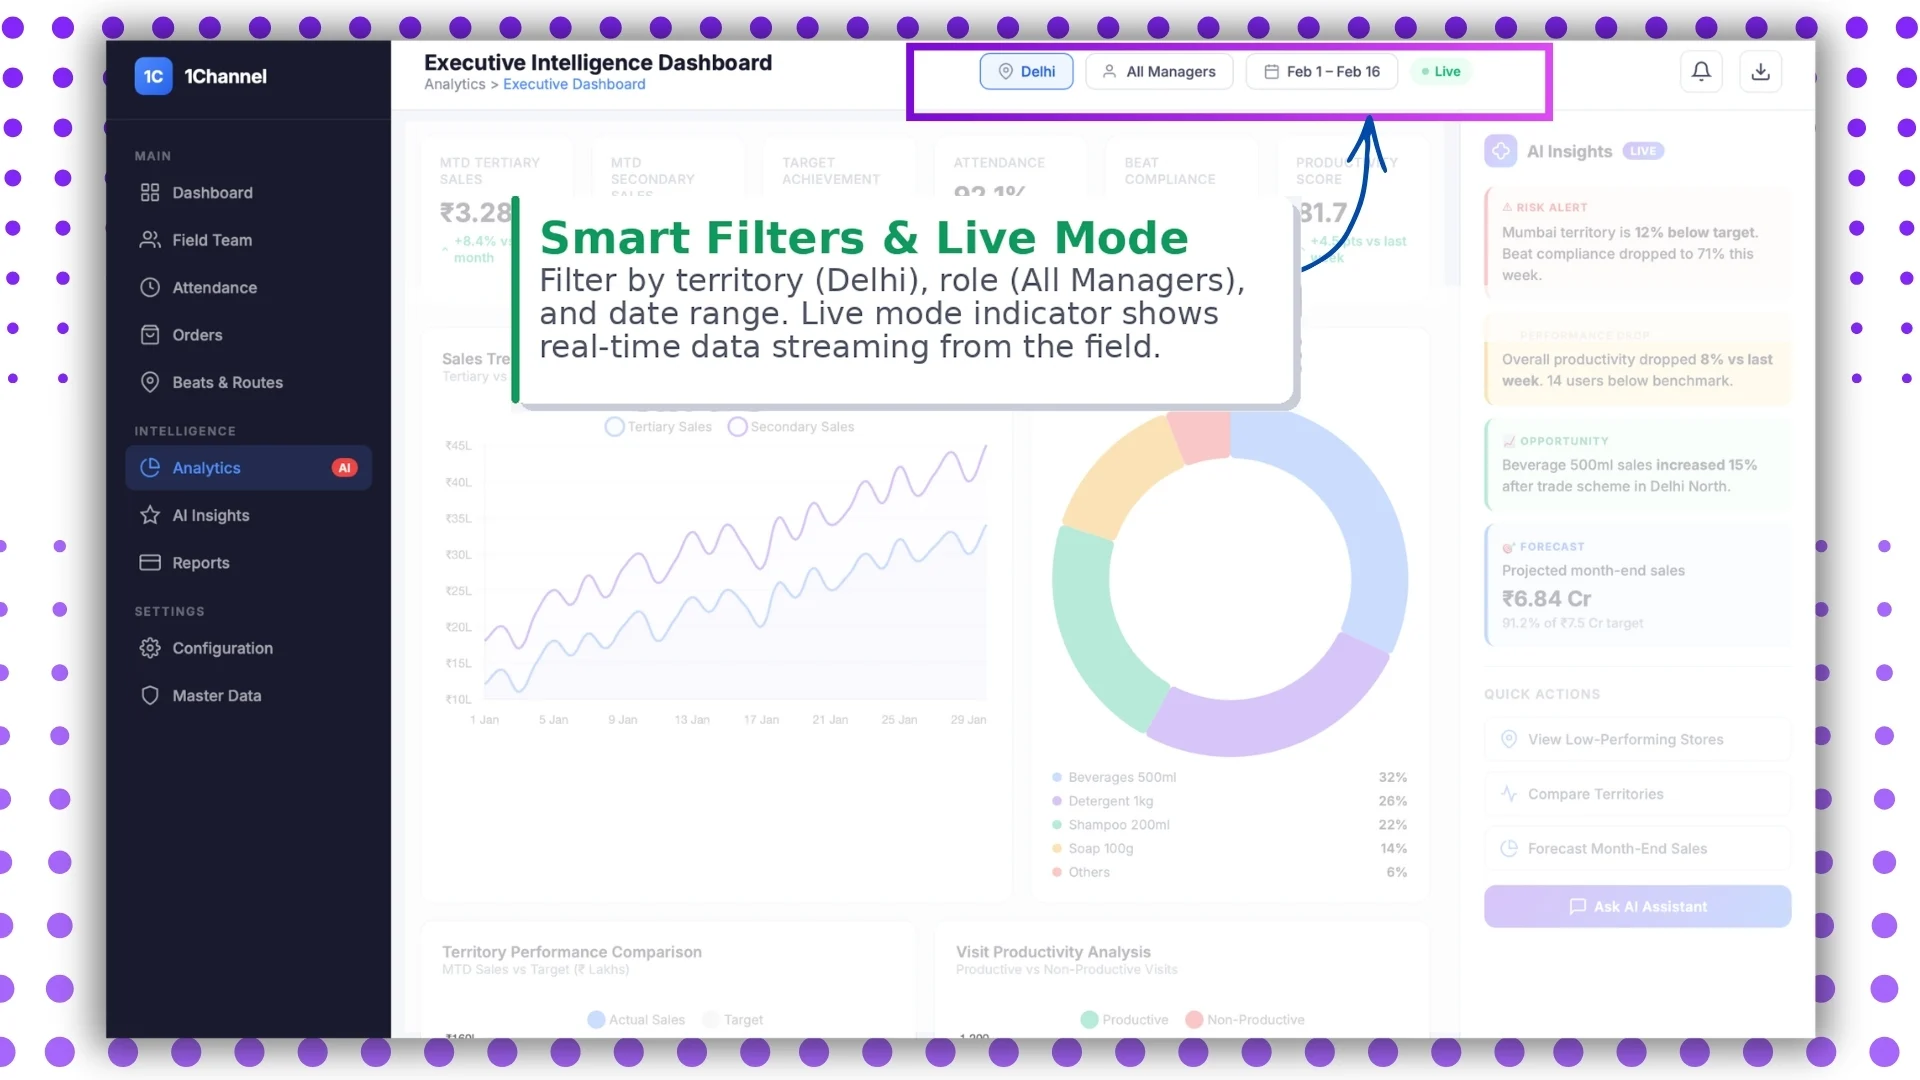
Filters narrow the dashboard to a region, channel, partner tier, or beat. Live mode lets the leader watch the data update in front of them during the meeting, which makes the conversation evidence-led rather than memory-led.
How AI Tilts the Read Toward Action
A live dashboard with no signal filter is just a faster firehose. The reader still has to spot the patterns, and at scale the patterns hide inside the volume of green tiles.
AI-powered insight detection sits on top of the data and surfaces the patterns automatically. Drift, concentration, anomaly, projection: each gets a tile of its own, and the leader walks into the meeting with a short list instead of a wide screen.
How 1Channel Runs Real-Time Sales Dashboards for Malaysian Programs
1Channel runs real-time sales dashboards through its cloud Sales Force Automation and analytics modules. Every event from the field updates the dashboard automatically against the configured KPIs, with sub-minute latency on most tiles.
1Channel's AI engine watches the underlying patterns and surfaces the ones leadership should care about. KPIs trending toward amber, territories concentrated in one rep, schemes met through a single channel: all flagged as soft alerts before they reach the morning review.
Configuration runs through the admin console. New KPIs, filters, layouts, and export formats go live the same day they are approved, with an automated dry-run preview that validates the impact before activation.
Explore Cloud Sales Analytics Software
1Channel's cloud sales analytics platform powers real-time dashboards with AI signal detection and automated KPI rollups.
Explore Sales Analytics Software →Common Pitfalls in Reading the Live Dashboard
Teams that move to real-time dashboards learn a few patterns the hard way:
- Reading the totals before the trends. A green KPI today can be amber by next week. The trend is the leading indicator; the total is the trailing one.
- Ignoring the AI insights panel. The panel exists to do the pattern-spotting the human reader cannot do at scale. Skipping it puts the meeting back on memory.
- Filtering only during the meeting. Pre-built filtered views save 20 minutes off the meeting time. Filtering live in front of an audience signals that the prep was thin.
- Confusing live mode with rapid-fire decisions. Real-time data is a signal, not an order. Knee-jerk decisions on intraday spikes usually unwind by the next morning.
- Forgetting that the dashboard reads only as cleanly as the data. A broken sync, a stale master, or a misconfigured KPI all surface as confident wrong numbers. Trust the chain, not just the tile.