Training a sales team is only valuable when you can see what is working and what is not. A consumer electronics company in Selangor might create 12 training modules for 80 promoters across retail outlets, but without progress tracking, the training manager has no way to know whether 60 promoters completed the modules or only 20, which topics had the lowest quiz scores, or which promoters are ready for advancement to the next level.
An LMS with built-in progress tracking and reporting turns training from an assumed activity into a verified, measurable one. Every module completion, quiz result, session attendance, badge earned, and level progression is recorded and visible through dashboards and analytics screens. This article walks through how each tracking feature works and what data it provides to training managers at Malaysian businesses.
Table of Contents
Role-Based Access for Progress Tracking
The LMS operates through three interfaces for three user types. The admin portal is the command centre where all progress data is visible and manageable. Trainers access their assigned sessions, mark attendance, and view their own session data through the mobile app. Employees see their personal progress, assigned modules, quiz scores, and earned badges through the employee app.
Progress reporting is primarily managed through the admin portal, which provides full control over users, modules, sessions, quizzes, and analytics. Everything that happens in the trainer and employee apps syncs to the admin portal in real time.
The Admin Dashboard
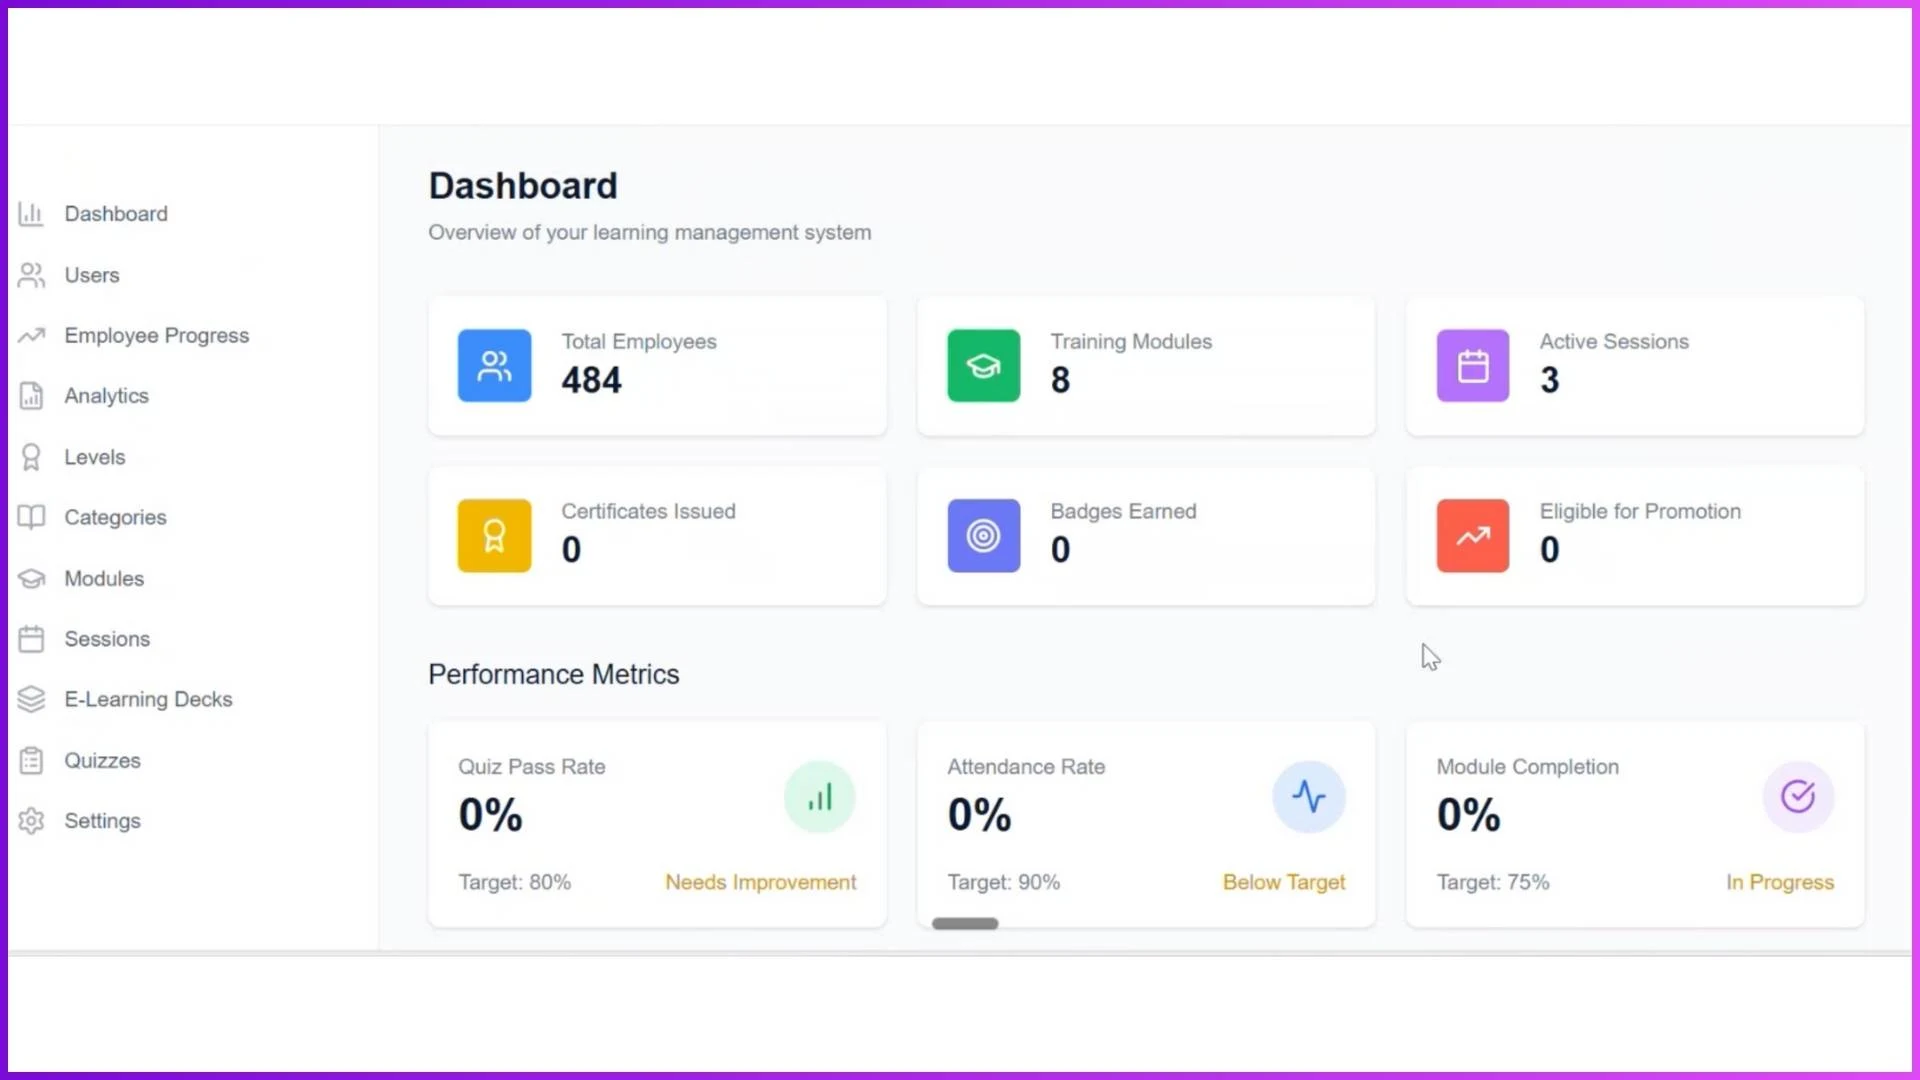
The dashboard is the first screen the admin sees after logging in. It provides an instant snapshot of the entire training operation across the organisation. The key metrics visible at a glance include total employees registered in the system, number of training modules created, active sessions currently running, certifications issued, badges earned across the team, and the number of employees eligible for promotion based on their progress criteria.
The performance matrix section shows quiz pass rates, attendance rates, and module completion percentages as aggregate figures. Quick action buttons allow the admin to navigate directly to user management, progress tracking, modules, sessions, or quizzes without going through multiple menu layers.
For a training manager at an FMCG company overseeing 100 merchandisers across Klang Valley and Johor, this dashboard provides the daily pulse check: are people completing training, are quiz scores acceptable, and who is falling behind.
Employee Progress Tracking
The employee progress section is the core reporting area for tracking individual learning performance. It displays summary cards for total employees, those eligible for promotion, average completion rate across all modules, and average attendance across all sessions.
A search function lets the admin look up any specific employee and view their complete learning profile. The progress table shows each employee's name, current level, module progress (as a percentage), achievements (certificates and badges earned), and promotion status. This structured view makes it straightforward to identify who is on track, who is behind, and who has met all the criteria for advancement.
For a regional training coordinator at a telco company managing promoters across Penang and Sabah, this screen answers the question "How is each person doing?" without needing to call regional managers for updates.

Levels and Promotion Readiness
The levels system ties directly into progress tracking by defining measurable criteria for advancement. Admins create levels (Level 0, Level 1, Level 2, and so on) and configure promotion requirements for each, which can include a percentage of certificates received, minimum tenure in days, and average productivity metrics.
The progress dashboard shows which employees have met all criteria and are ready for promotion. When an employee is promoted to the next level, new modules and sessions unlock automatically in their app. This creates a clear, data-driven promotion path that the admin can monitor centrally rather than relying on subjective assessments from regional managers.

Modules and Session Tracking
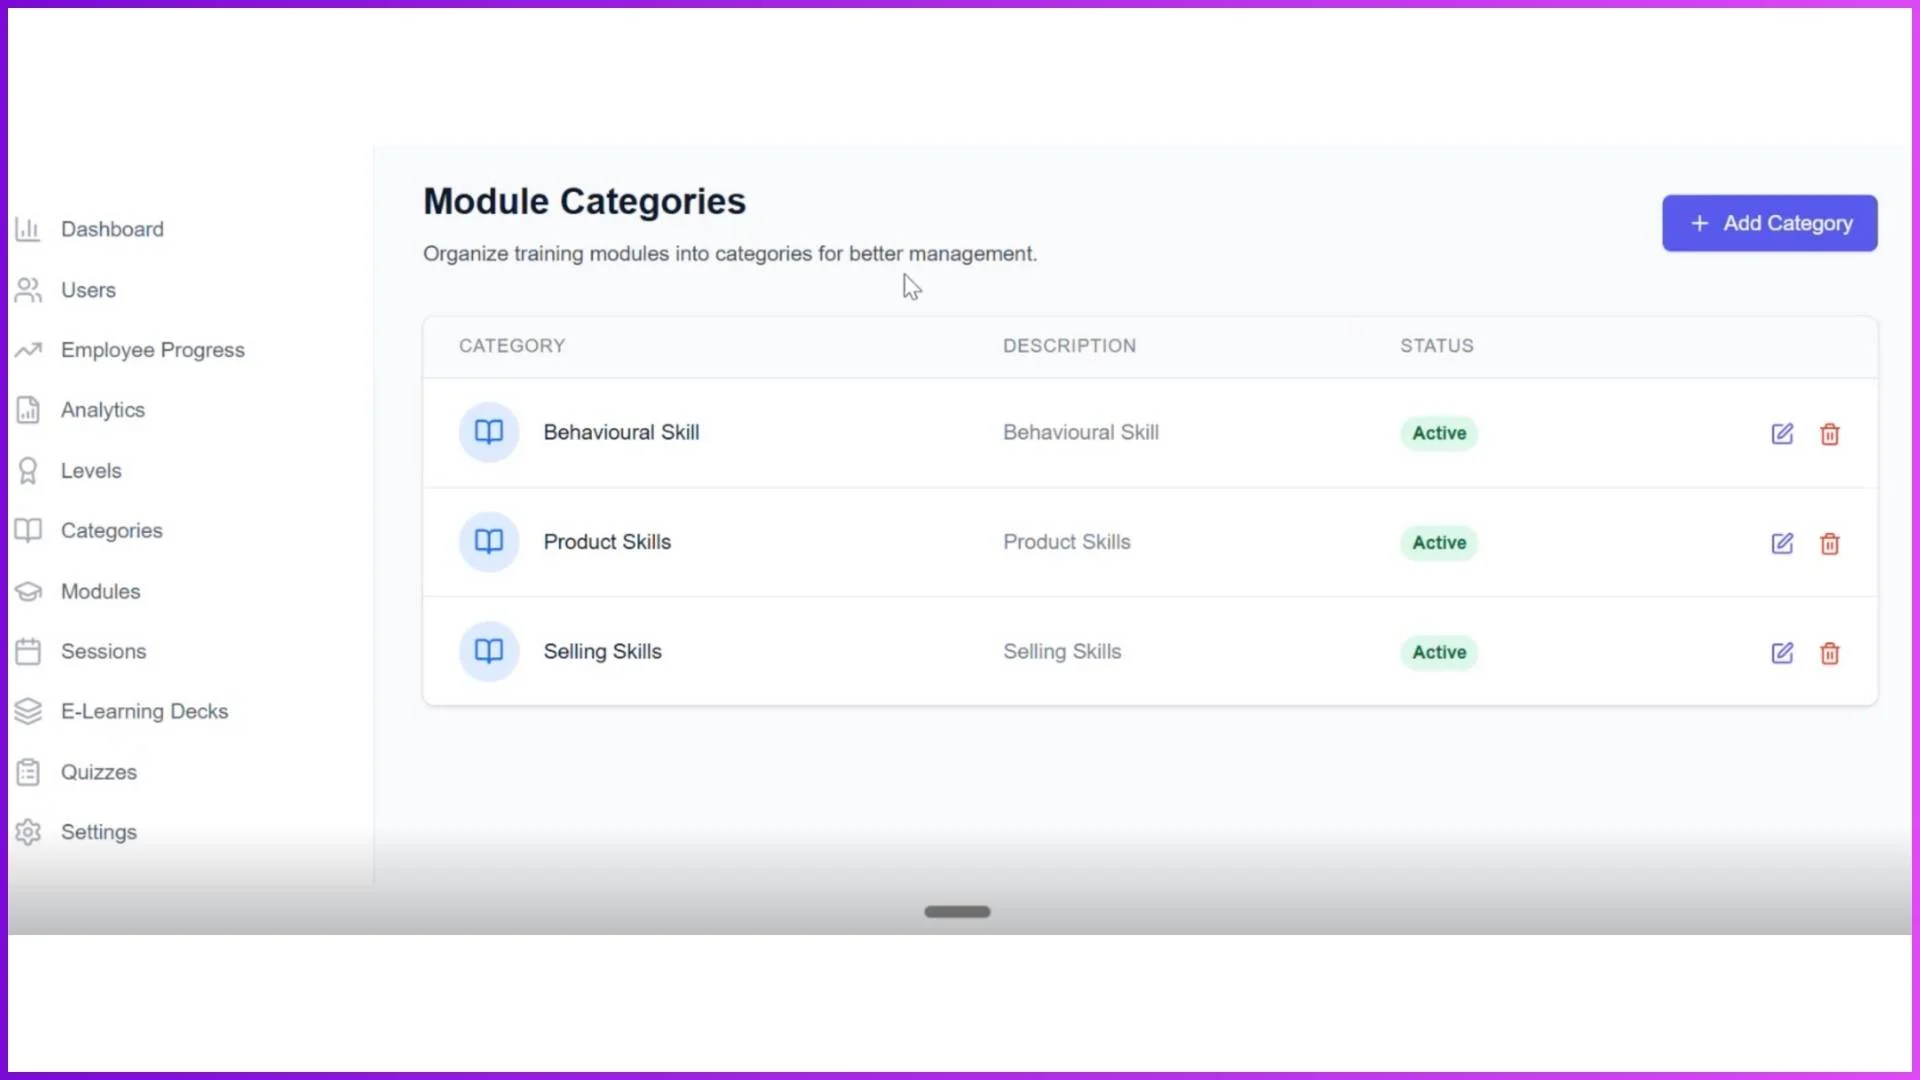
Each module is organised under a category (Product Knowledge, Selling Techniques, Compliance) and mapped to a specific level. The admin can see how many employees are enrolled in each module, how many have completed it, and what the completion rate is. This module-level visibility reveals which training content is being consumed and which is being ignored.
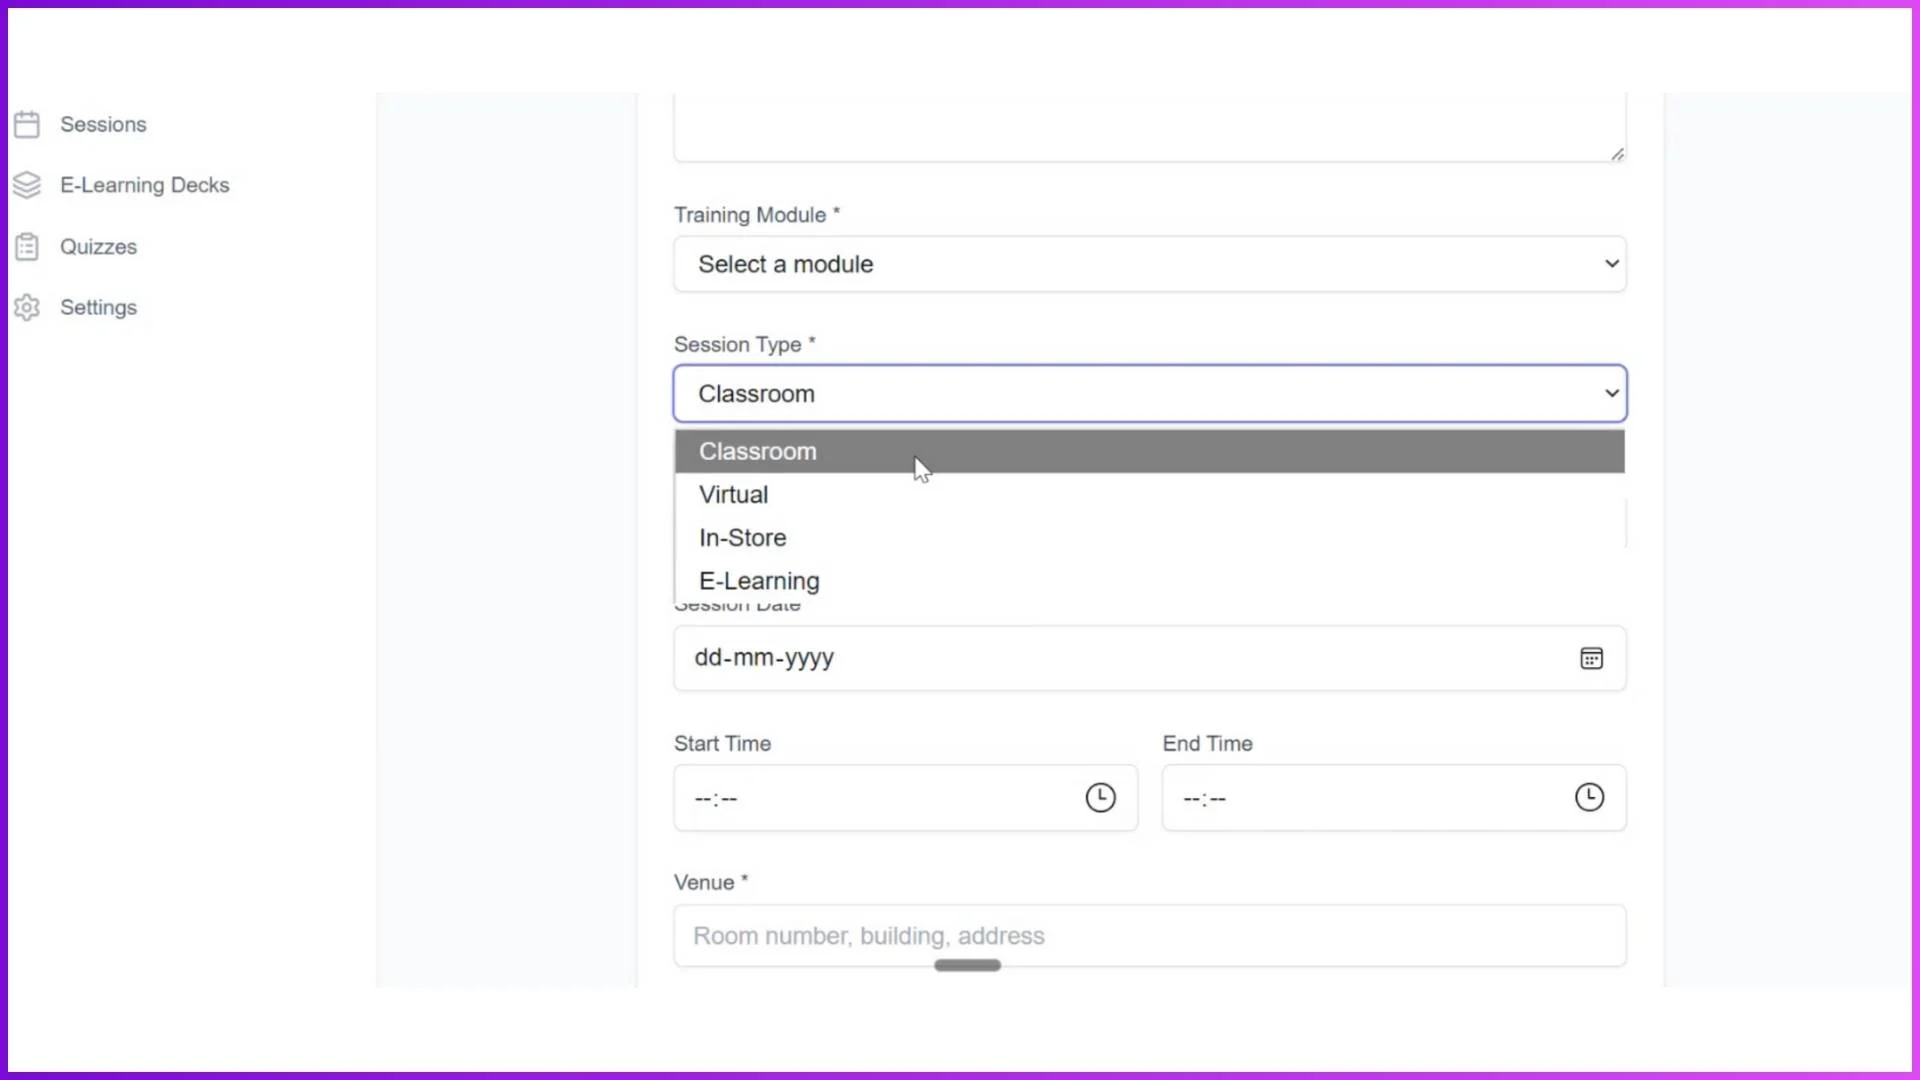
Sessions within each module carry their own attendance records. Classroom and in-store sessions include photo-based and geo-tagged attendance. Virtual sessions record attendance before the meeting link is accessed. E-learning sessions can require minimum time spent on content before marking completion. All of this attendance data feeds into the employee's overall progress profile.
Quiz Performance Data
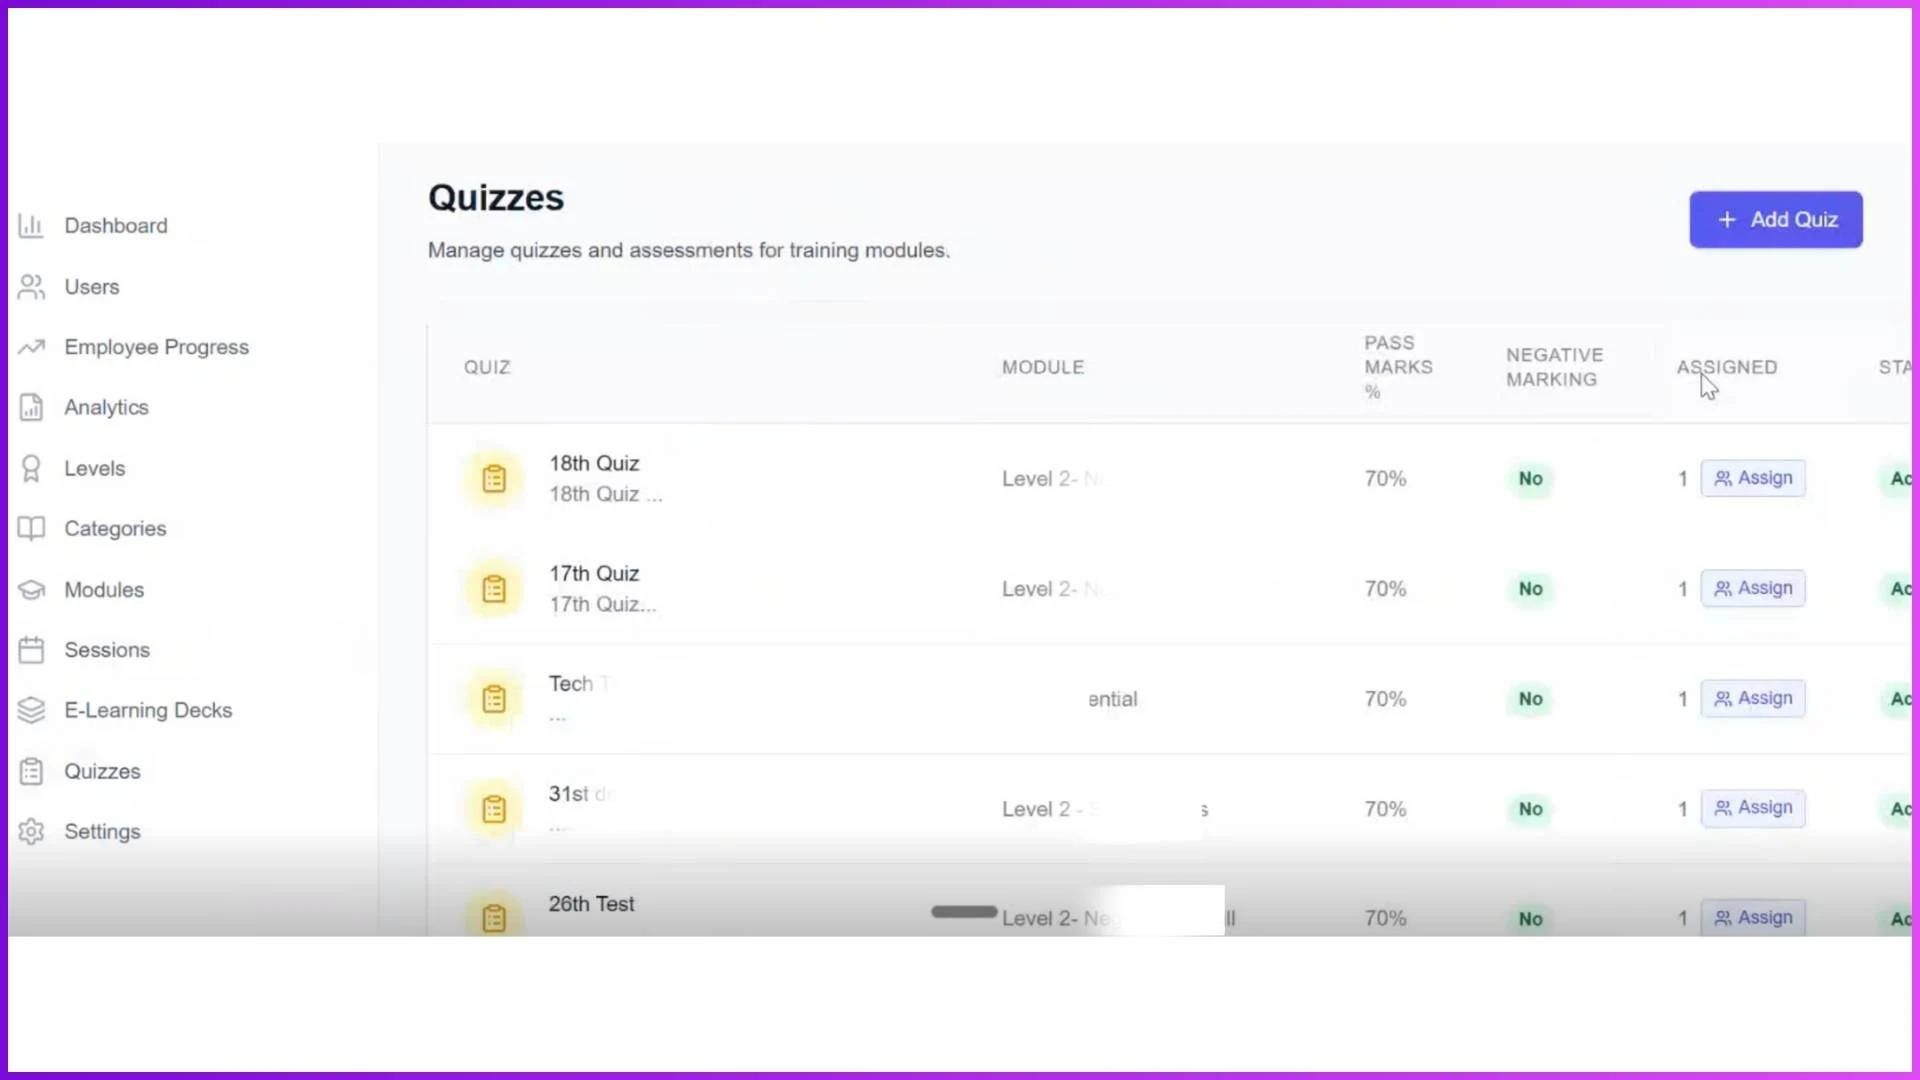
Quizzes provide the most direct measurement of knowledge retention. The admin can see quiz-level data including pass rates, average scores, number of attempts used, and average attempts needed to pass. This data is broken down by module and by employee level.
When a particular quiz has a 45 percent pass rate while others are at 80 percent, the admin knows either the quiz is too difficult, the training content did not adequately prepare employees, or the topic itself needs more attention in future sessions. This kind of diagnostic insight only exists when quiz performance is tracked systematically rather than treated as a standalone assessment.
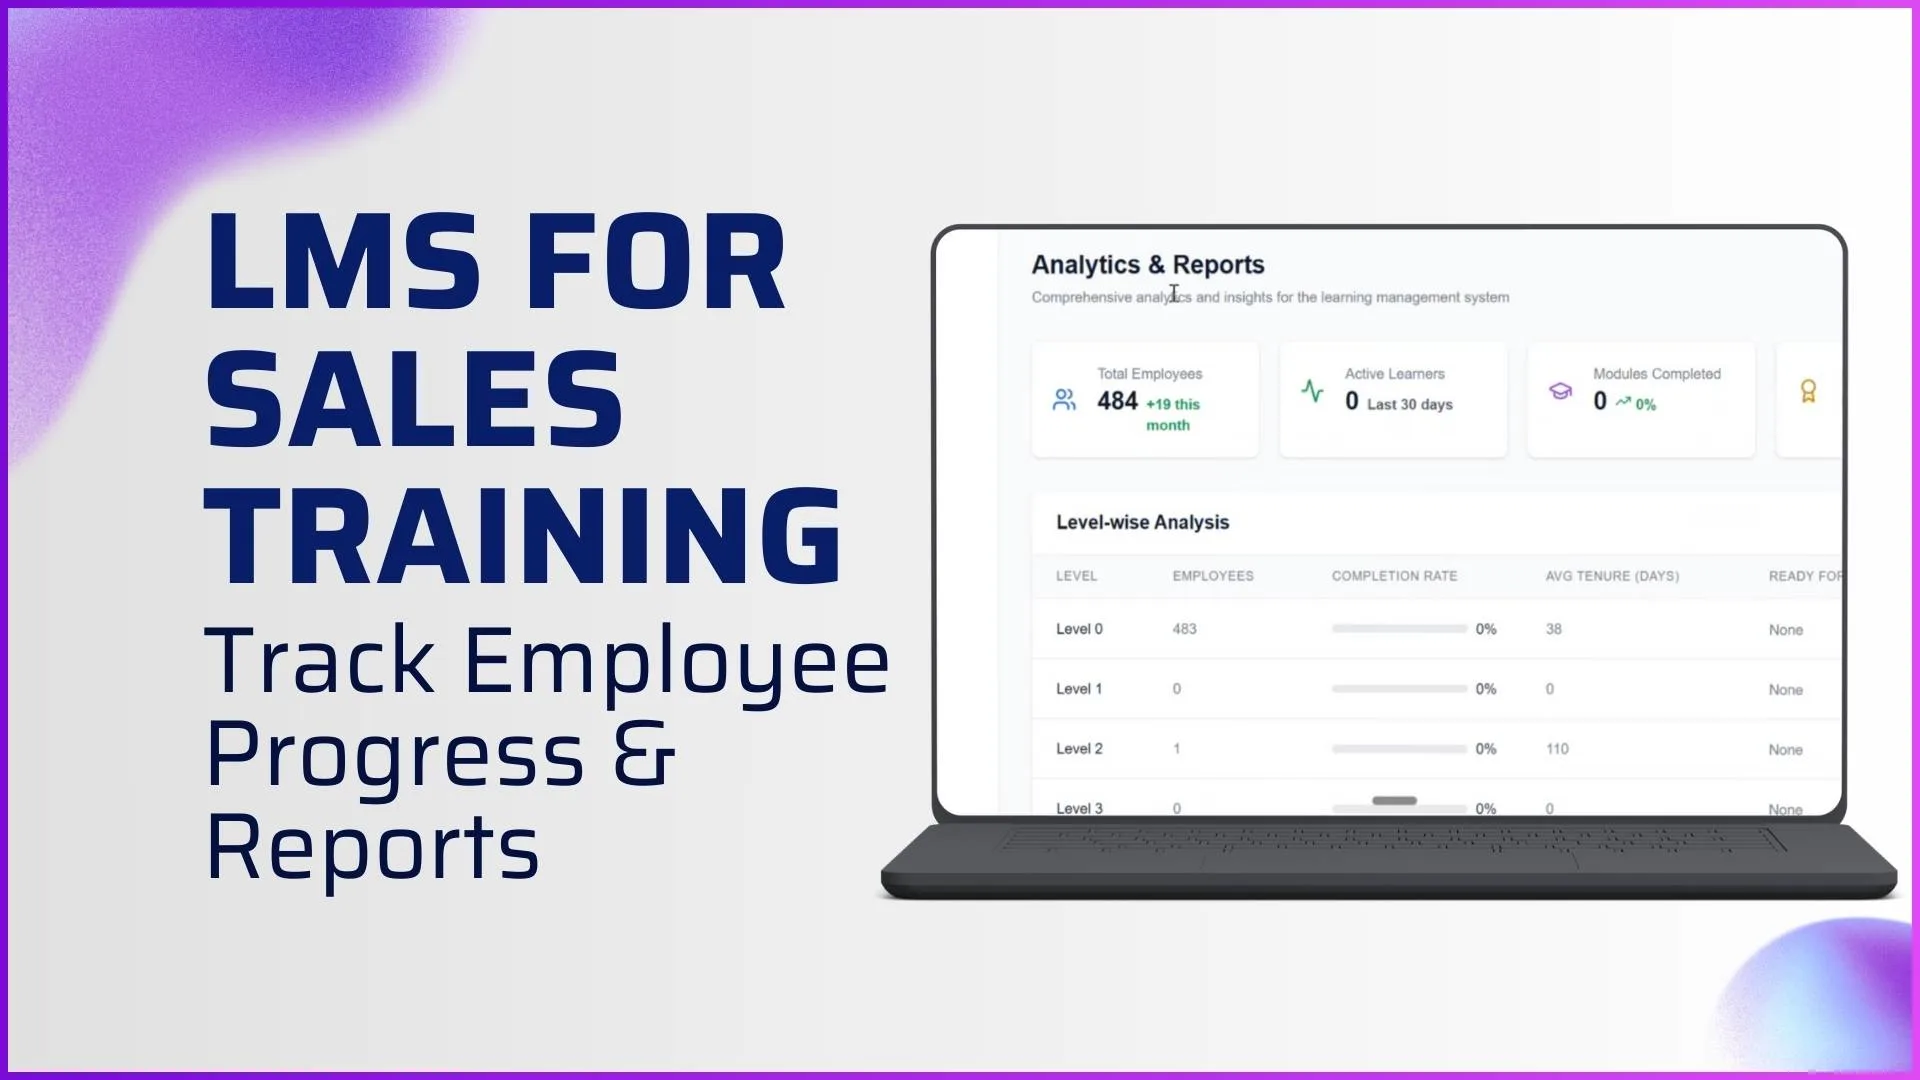
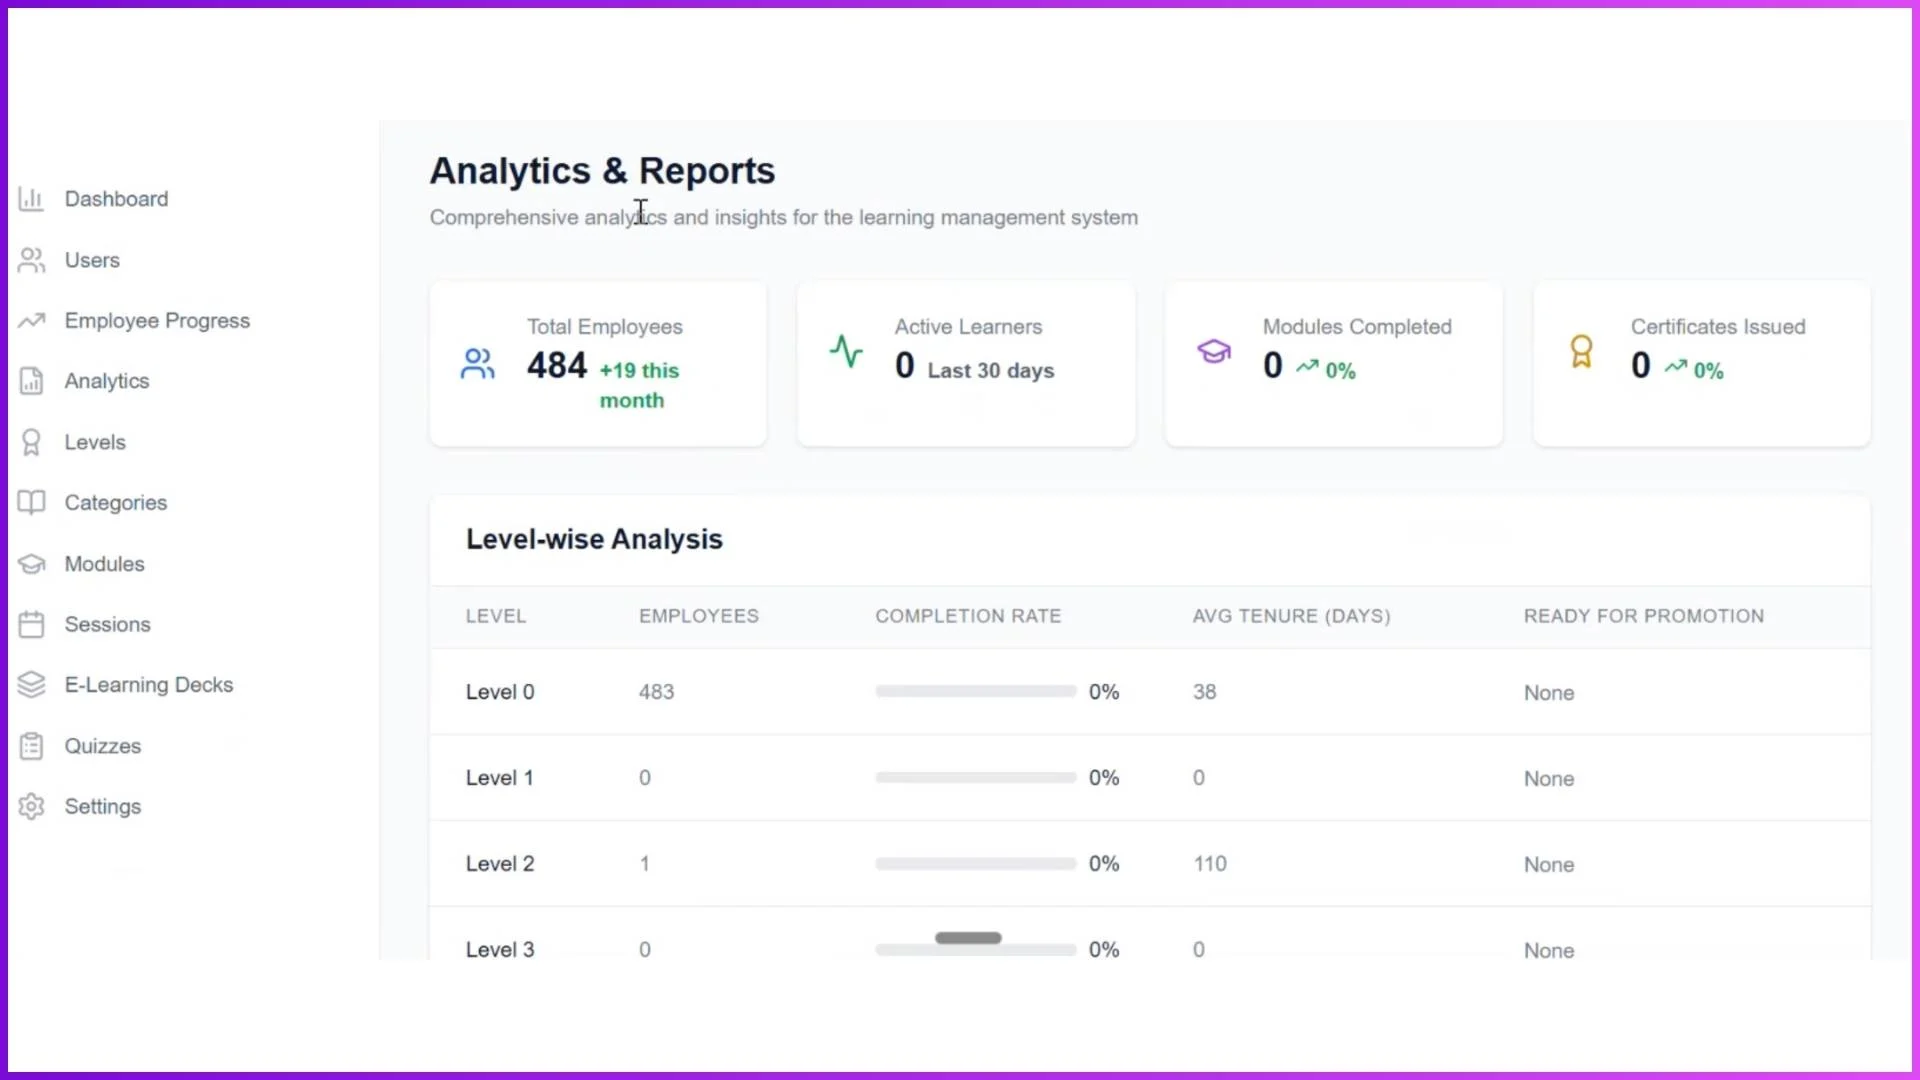
Analytics and Reports
The analytics screen consolidates all training data into structured views that admins can use for strategic decision-making. The four main analytical views are:
Level-Wise Analysis
Shows employee count per level, completion rate, average tenure, and how many are ready for promotion. Answers: "How is each cohort progressing?"
Module Performance
Shows enrolled vs completed counts, completion rate, and average days to complete per module. Answers: "Which training content is effective and which needs improvement?"
Quiz Analytics
Shows attempts, pass rate, average score, and average attempts to pass per quiz. Answers: "Where are the knowledge gaps?"
Trainer Performance
Shows sessions conducted, students taught, average attendance, and certificates issued per trainer. Answers: "Which trainers are delivering the best outcomes?"
For a Malaysian company with trainers conducting sessions across Selangor, Penang, and Johor, the trainer performance view is particularly valuable because it shows which trainers achieve higher attendance and completion rates, indicating either better content delivery or more effective engagement techniques that can be replicated across the team.
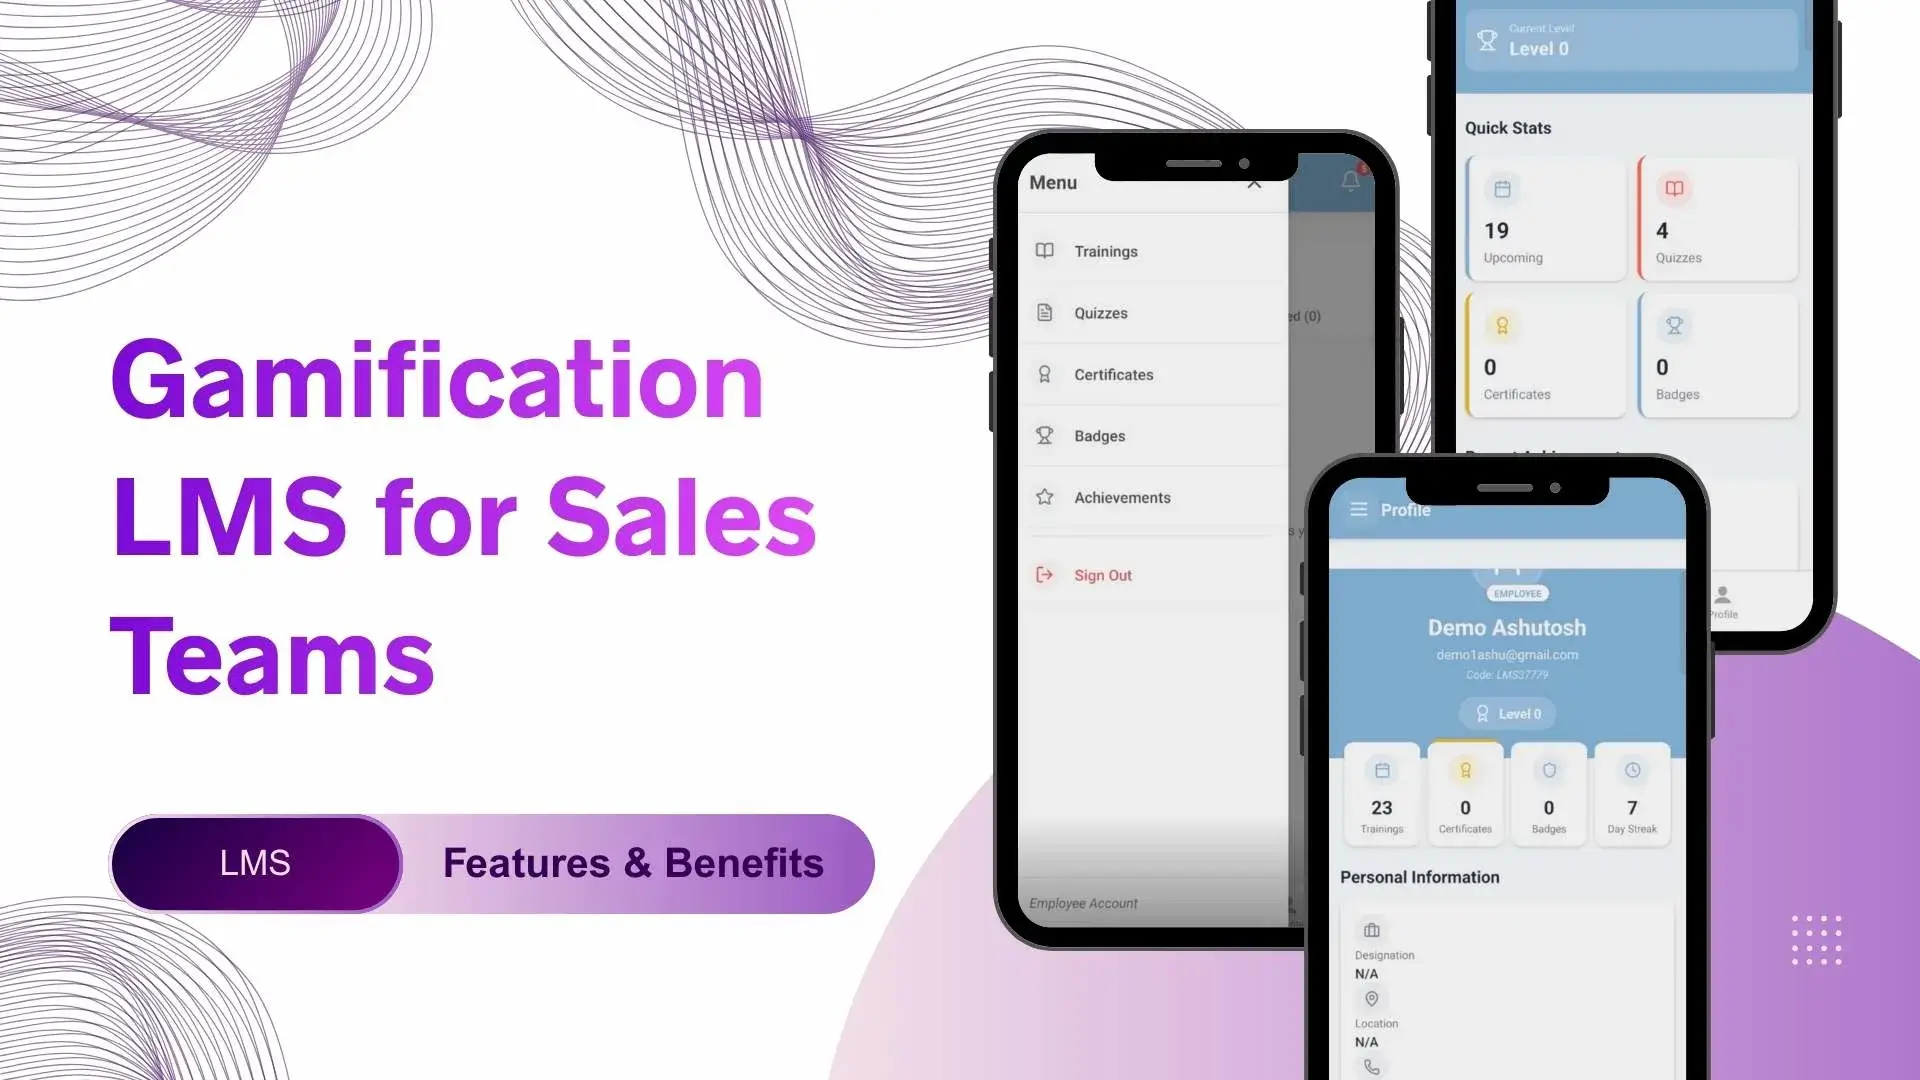
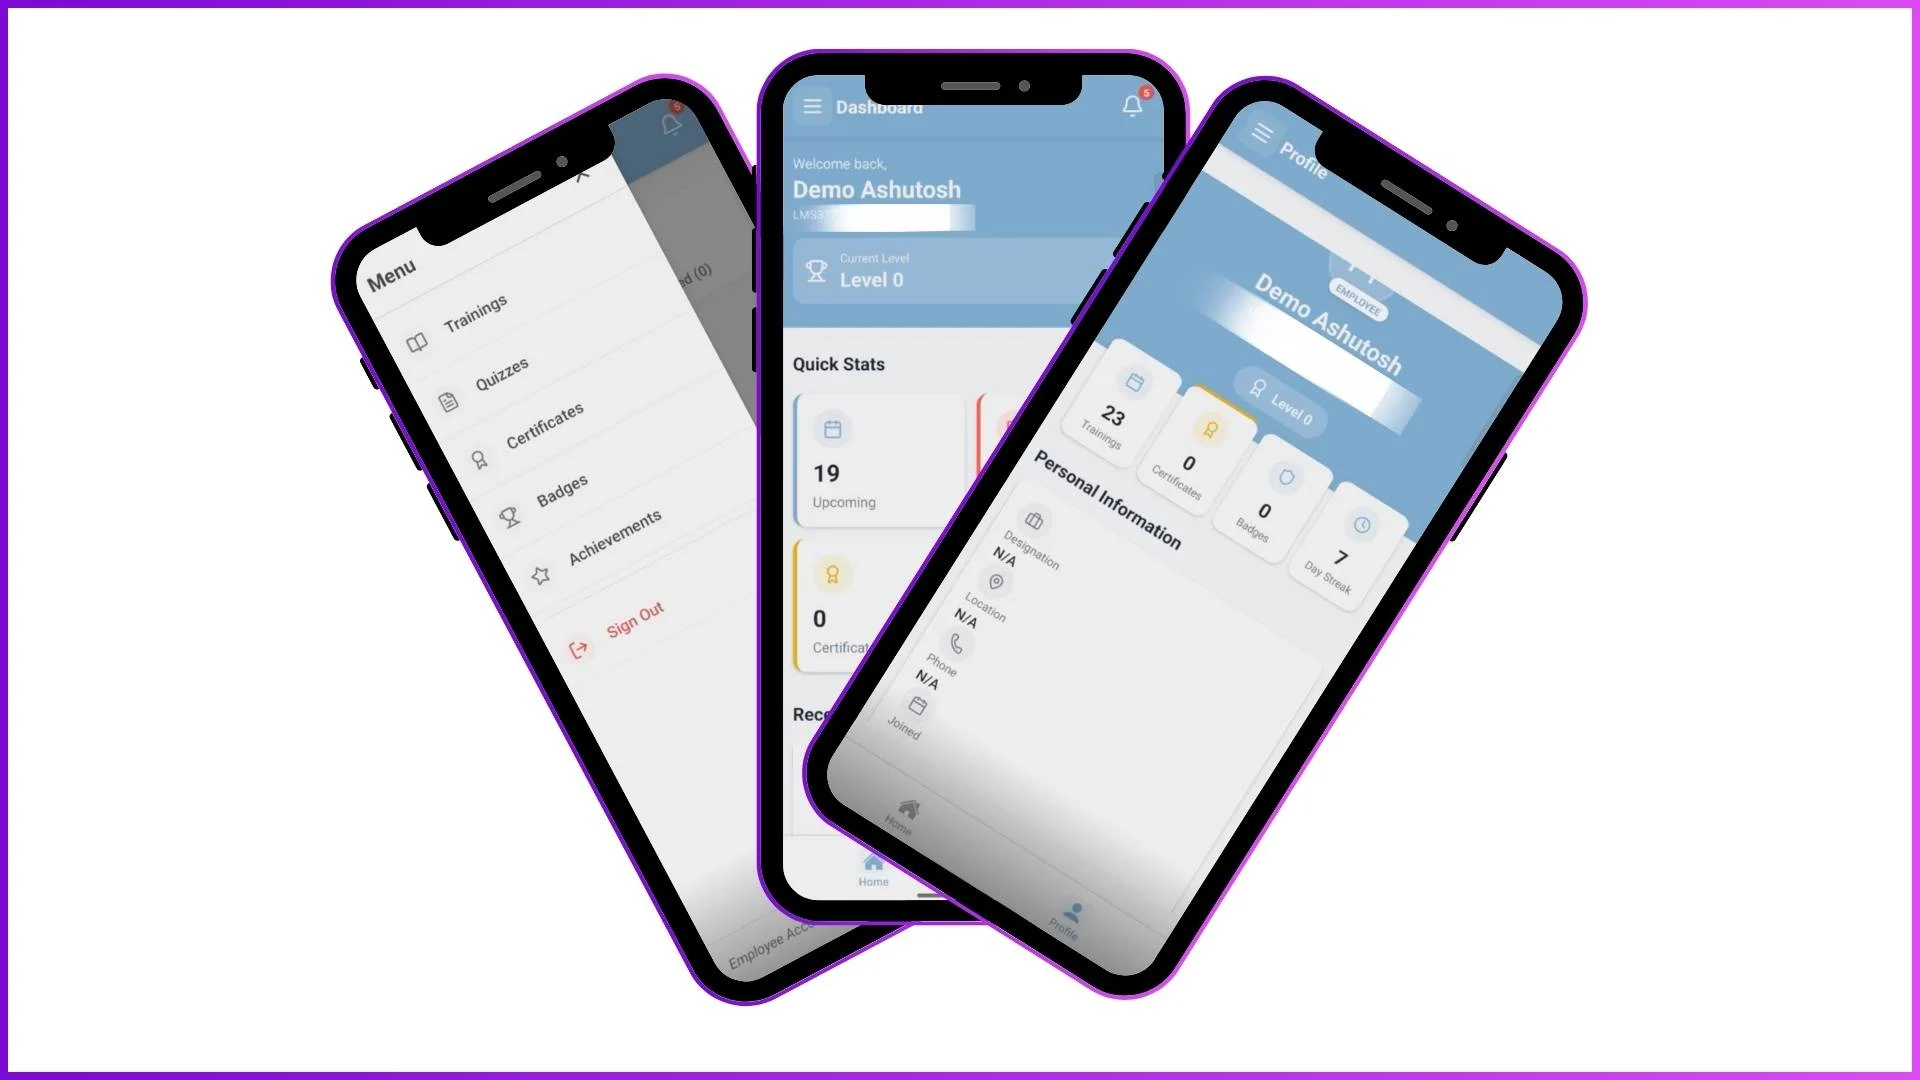
Mobile App for Real-Time Progress
Employees view their own progress through the mobile app, including completed modules, earned badges and certificates, quiz scores, and their current level. Trainers use the app to mark attendance during in-store sessions, view their session schedules, and review assigned trainees. All data from the mobile app syncs to the admin portal in real time.
This means a promoter at a retail outlet in Bangsar who completes an e-learning module at 2 PM appears as "completed" on the admin dashboard within seconds. The admin does not wait for a weekly report to know the training was done.
Explore Sales Team LMS
1Channel's LMS platform provides comprehensive progress tracking with dashboards, level-based analytics, module and quiz performance reports, and real-time mobile sync for field sales teams.
Explore LMS Software →Progress tracking is what transforms an LMS from a content delivery system into a performance management tool. Without it, training is an expense. With it, training is an investment with measurable returns. For Malaysian businesses managing field sales teams across multiple states, the ability to see exactly who completed what, how they scored, and who is ready for the next level turns training decisions from guesswork into data-driven actions. Get in touch to explore how LMS progress tracking can work for your team.