Sales productivity at the manager's desk is not the same number that sits on a rep's dashboard. The rep sees personal volume and conversion. The manager sees discipline, coverage, and exception rate across the team.
A productive team is one where the daily inputs add up: attendance, visit, activity, report. When one slips, the downstream sales number eventually slips with it.
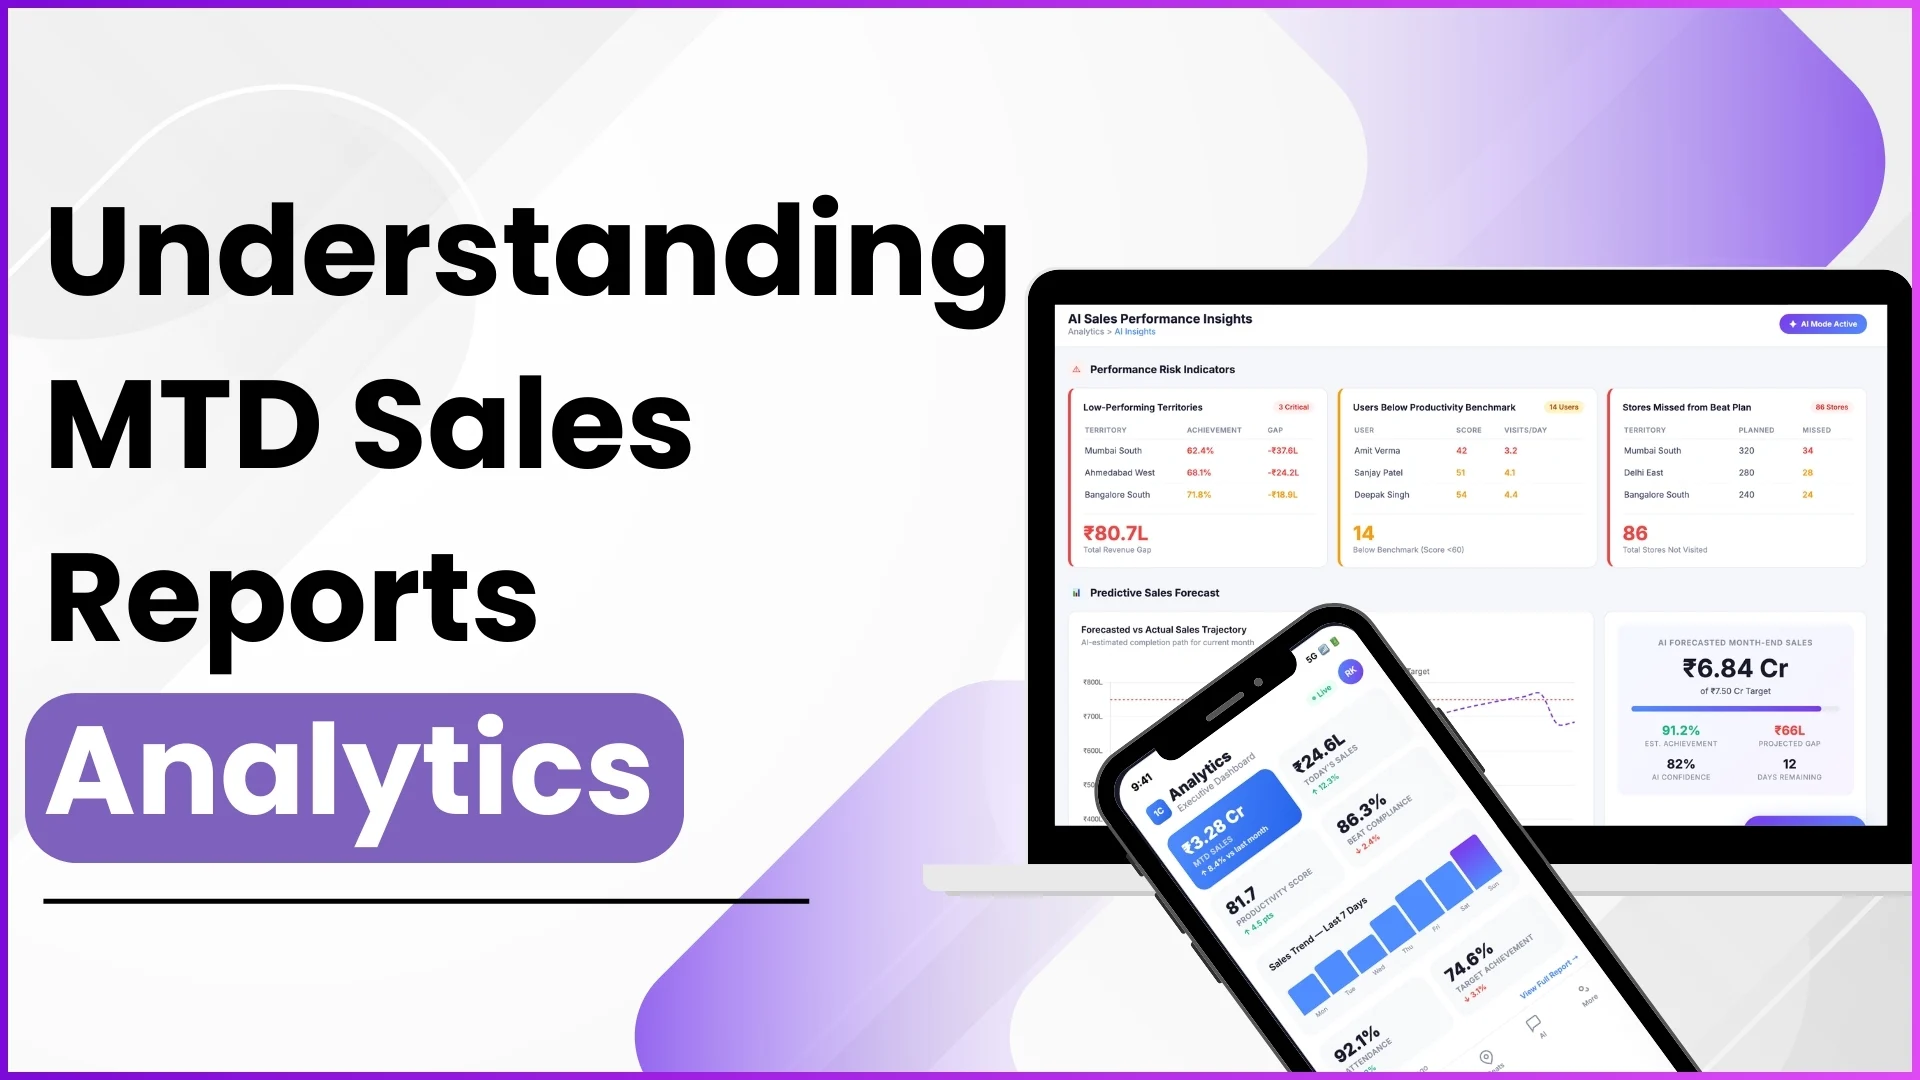
The metrics in this piece are the inputs, not the outputs. The cloud sales platform captures them automatically every day, so the manager reads patterns instead of chasing data.
Table of Contents
What Sales Productivity Actually Means at the Manager's Desk
Productivity at the team level is the discipline rate of the underlying inputs. How many reps logged attendance on time. How many beat plans were followed. How many planned visits cleared with a completed activity.
The output number is the consequence. If the inputs are healthy, the output usually follows. If the inputs are slipping, the output number will follow them down within a quarter.
Five Metric Categories That Tell the Whole Story
Most manager dashboards organise the productivity view around five metric categories:
- Attendance discipline. Reporting-on-time percentage, present-day percentage, late-attendance share. The first signal a rep is drifting from the routine.
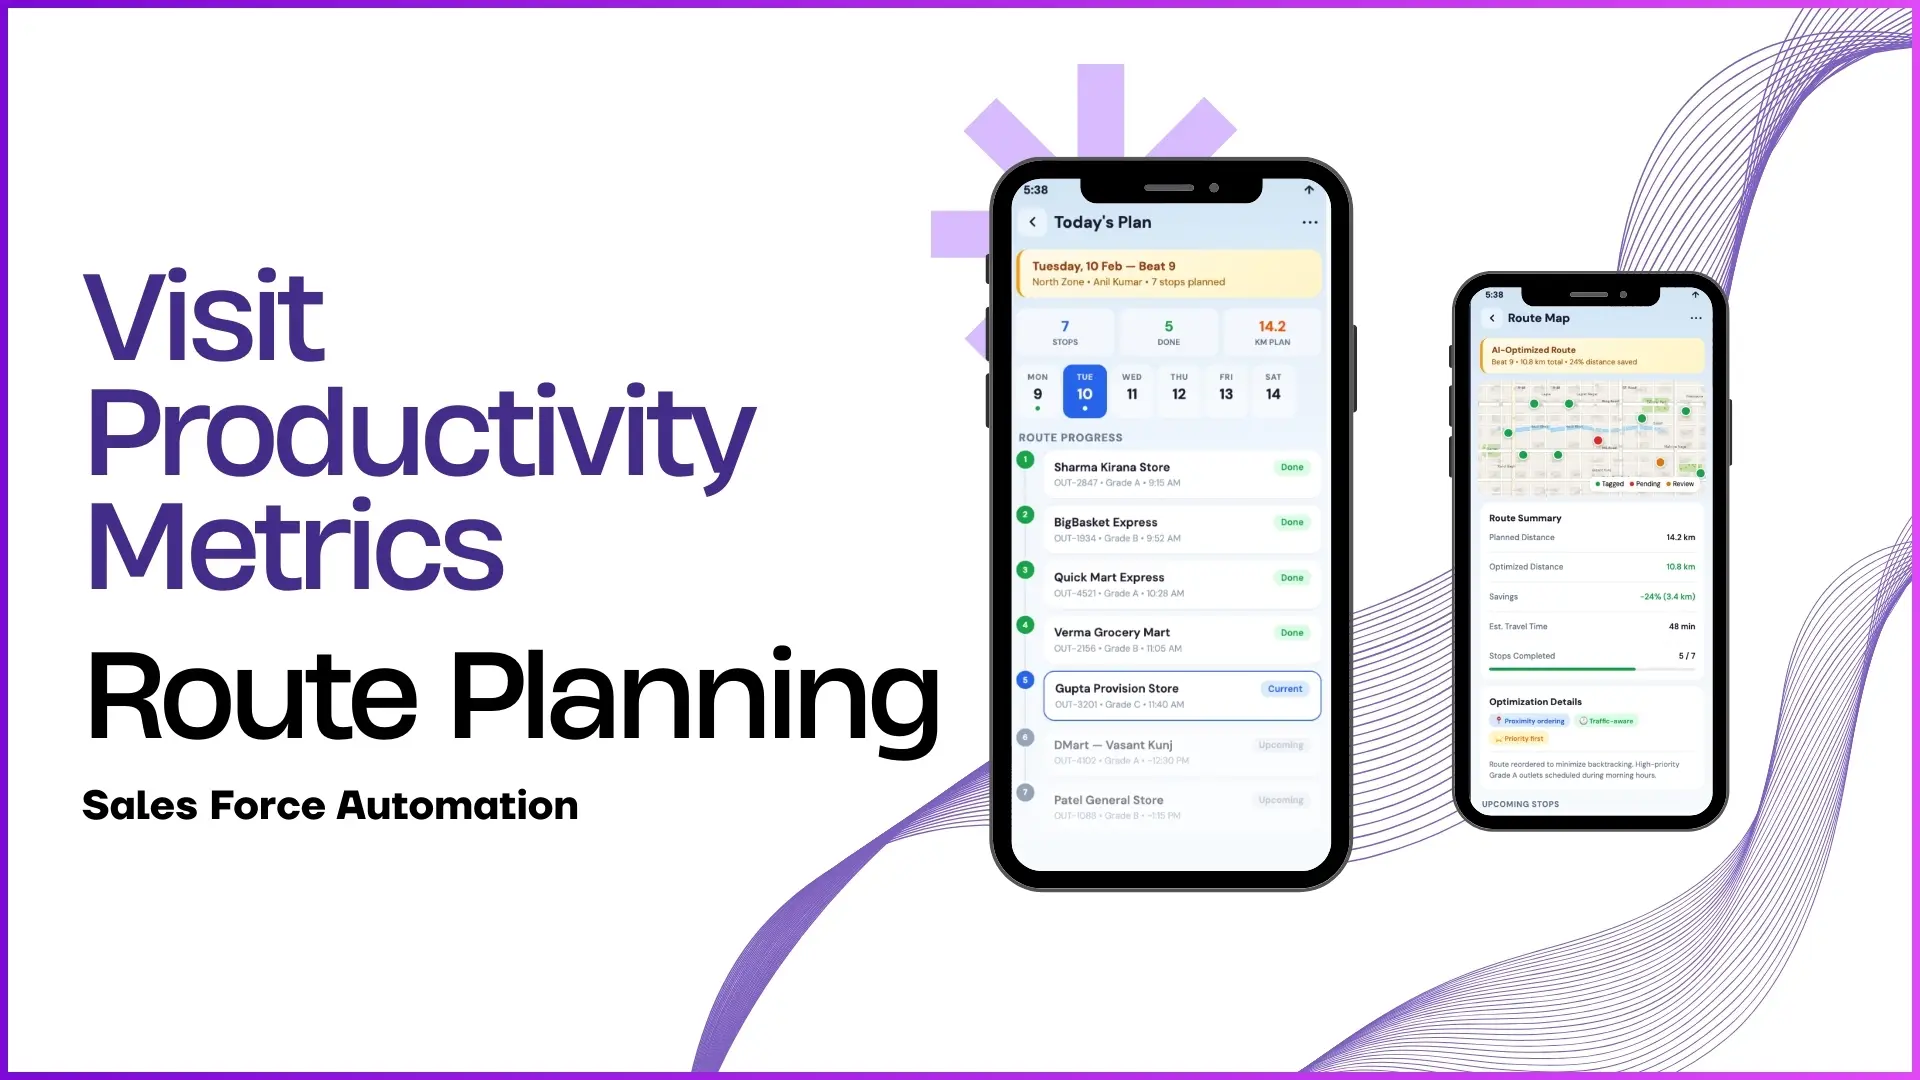
- Visit execution. Market visit count against the beat plan, beat compliance, activity completion per visit. Tells the manager whether the field is following the plan.
- Reporting consistency. Defaulted days, missed reports, late submissions. Reveals whether the rep is closing each day cleanly or skipping the discipline.
- Calendar alignment. Working days vs claimed days, holiday handling, off-cycle absences. The number HR cross-references when the cycle closes.
- Compliance roll-ups. Dashboards that match the rep's filed data against what the audit log shows. The cleanest measure of program health.
How the Numbers Read Together
No single metric carries the verdict. A 90 percent attendance number looks healthy until the visit-compliance number sits at 60 percent. The rep was present, but not where the plan said they should be.
Read the categories as a system. A drop in one paired with a steady number in another usually points to a specific operational gap, not a discipline problem across the board.
How 1Channel Surfaces Productivity Metrics for Malaysian Managers
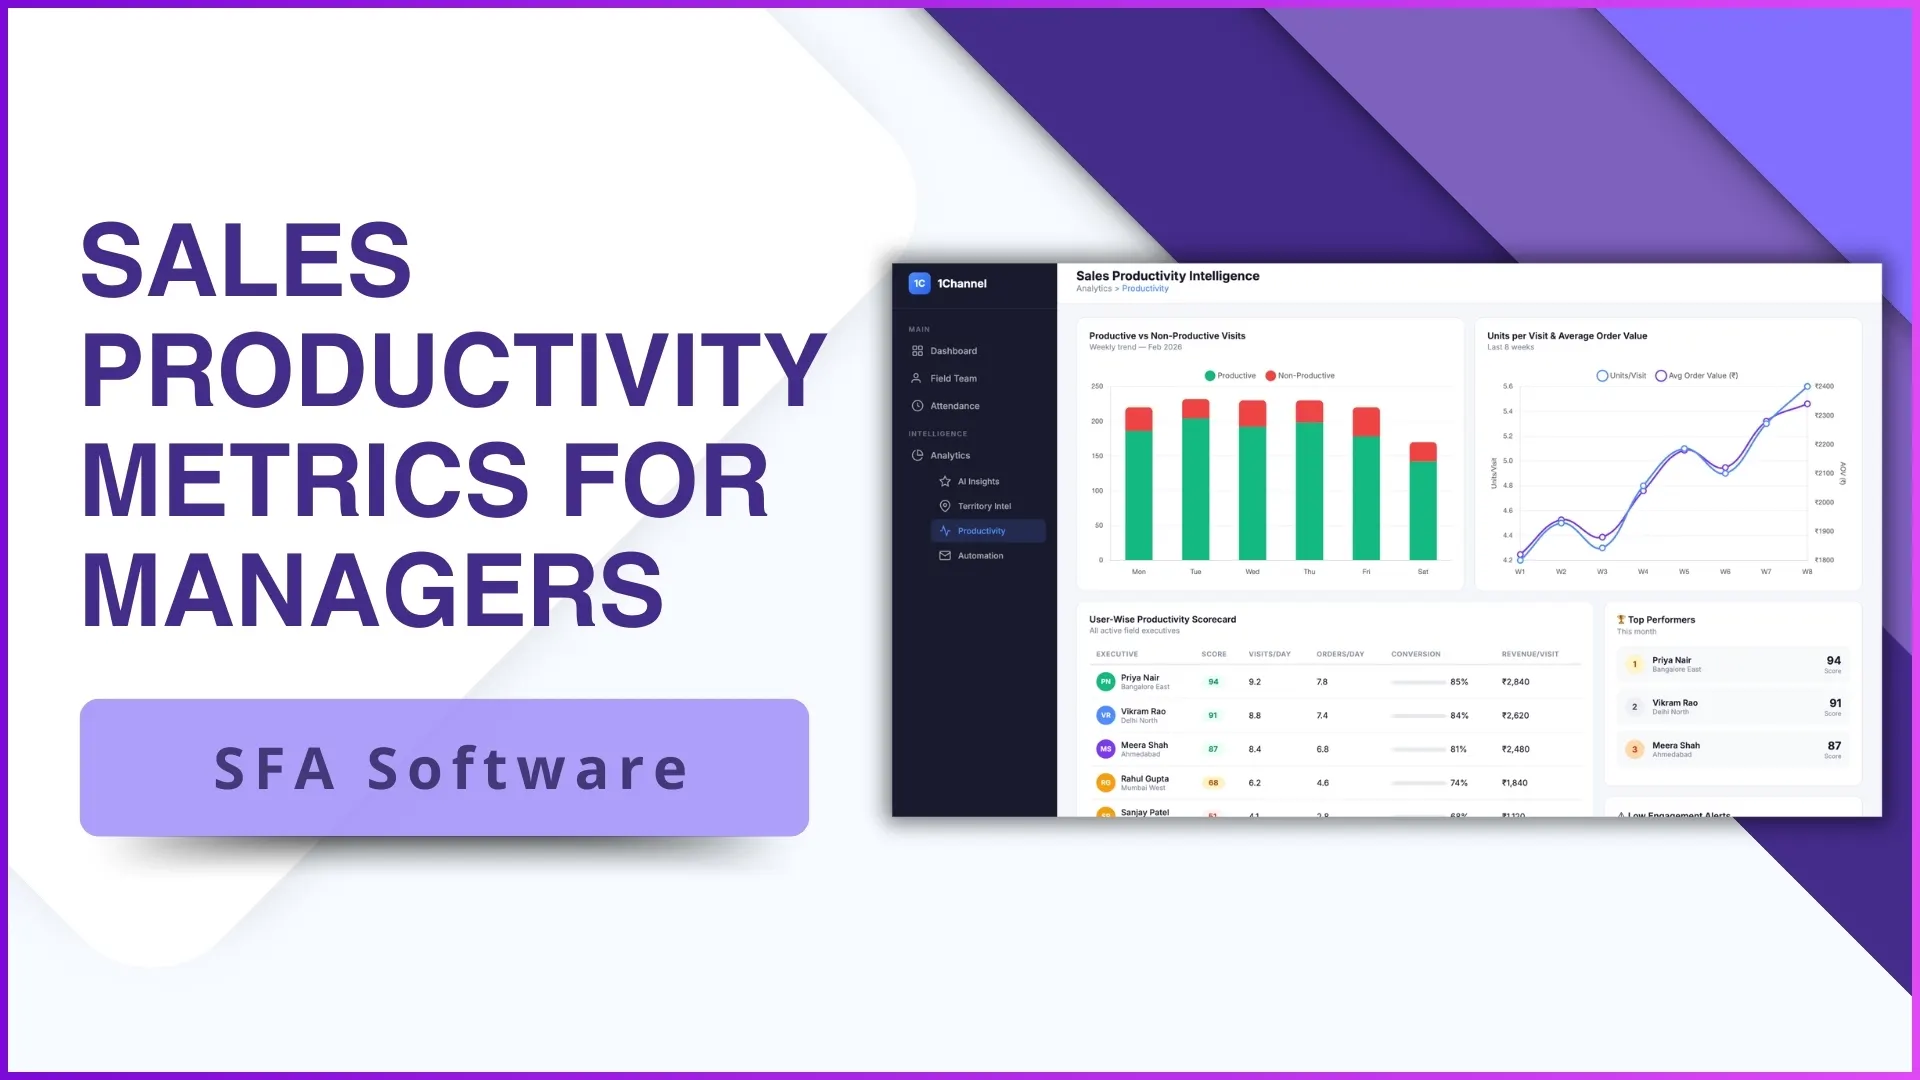
1Channel runs sales productivity tracking through its cloud Sales Force Automation and analytics modules. Attendance, visit, and reporting events post to the same ledger, so the five categories above compute on live data.
1Channel's AI engine watches for drift patterns at the team level. A cluster of reps whose visit-compliance number has fallen two quarters in a row gets flagged for the manager, ahead of the underlying revenue moving.
The dashboard segments by region, team, and beat. The underlying calculations are transparent, so the manager and the rep are reading the same number. Configuration is automated through the admin console without engineering tickets.
Explore Cloud Sales Analytics Software
1Channel's cloud sales analytics platform surfaces productivity metrics at the team level with AI-driven drift detection and automated rollups.
Explore Sales Analytics Software →Implementation Snapshot
A clean sequence to put a productivity dashboard in front of every manager:
- Pick the five categories first, not the individual metrics. The categories anchor the conversation; the underlying metrics are configurable per program.
- Choose two leading indicators and three lagging ones. The leading ones catch problems early; the lagging ones confirm whether the team is moving.
- Wire the cloud sales platform to capture all five categories without manual entry. Attendance from the geofencing module, visits from SFA, reports from the daily-close workflow.
- Set the daily and weekly cadences before the monthly review. Monthly reviews catch trends after the quarter is half-gone. Daily and weekly catch them while there is still time to act.
- Train the manager to read the categories together. A single-metric verdict is almost always wrong. The pattern across categories is what the dashboard is really showing.
- Schedule a quarterly recalibration. Metric thresholds should evolve as the team matures. A 70 percent visit-compliance target for a new region is generous; for a mature one, it is a problem.