By the third week of the month, the field organization already knows whether the month will close on target. The tertiary sales pace tells the first part of the story, distributor secondary sales fills in the picture, and the SKU-level mix points to what to push or pull in the final ten days. The MTD report surfaces all three on the cloud SFA without anyone having to compile spreadsheets at the regional office. By the time the manager opens the dashboard, the data has already been rolled up, ranked, and prepared for the conversation that needs to happen next.
Table of Contents
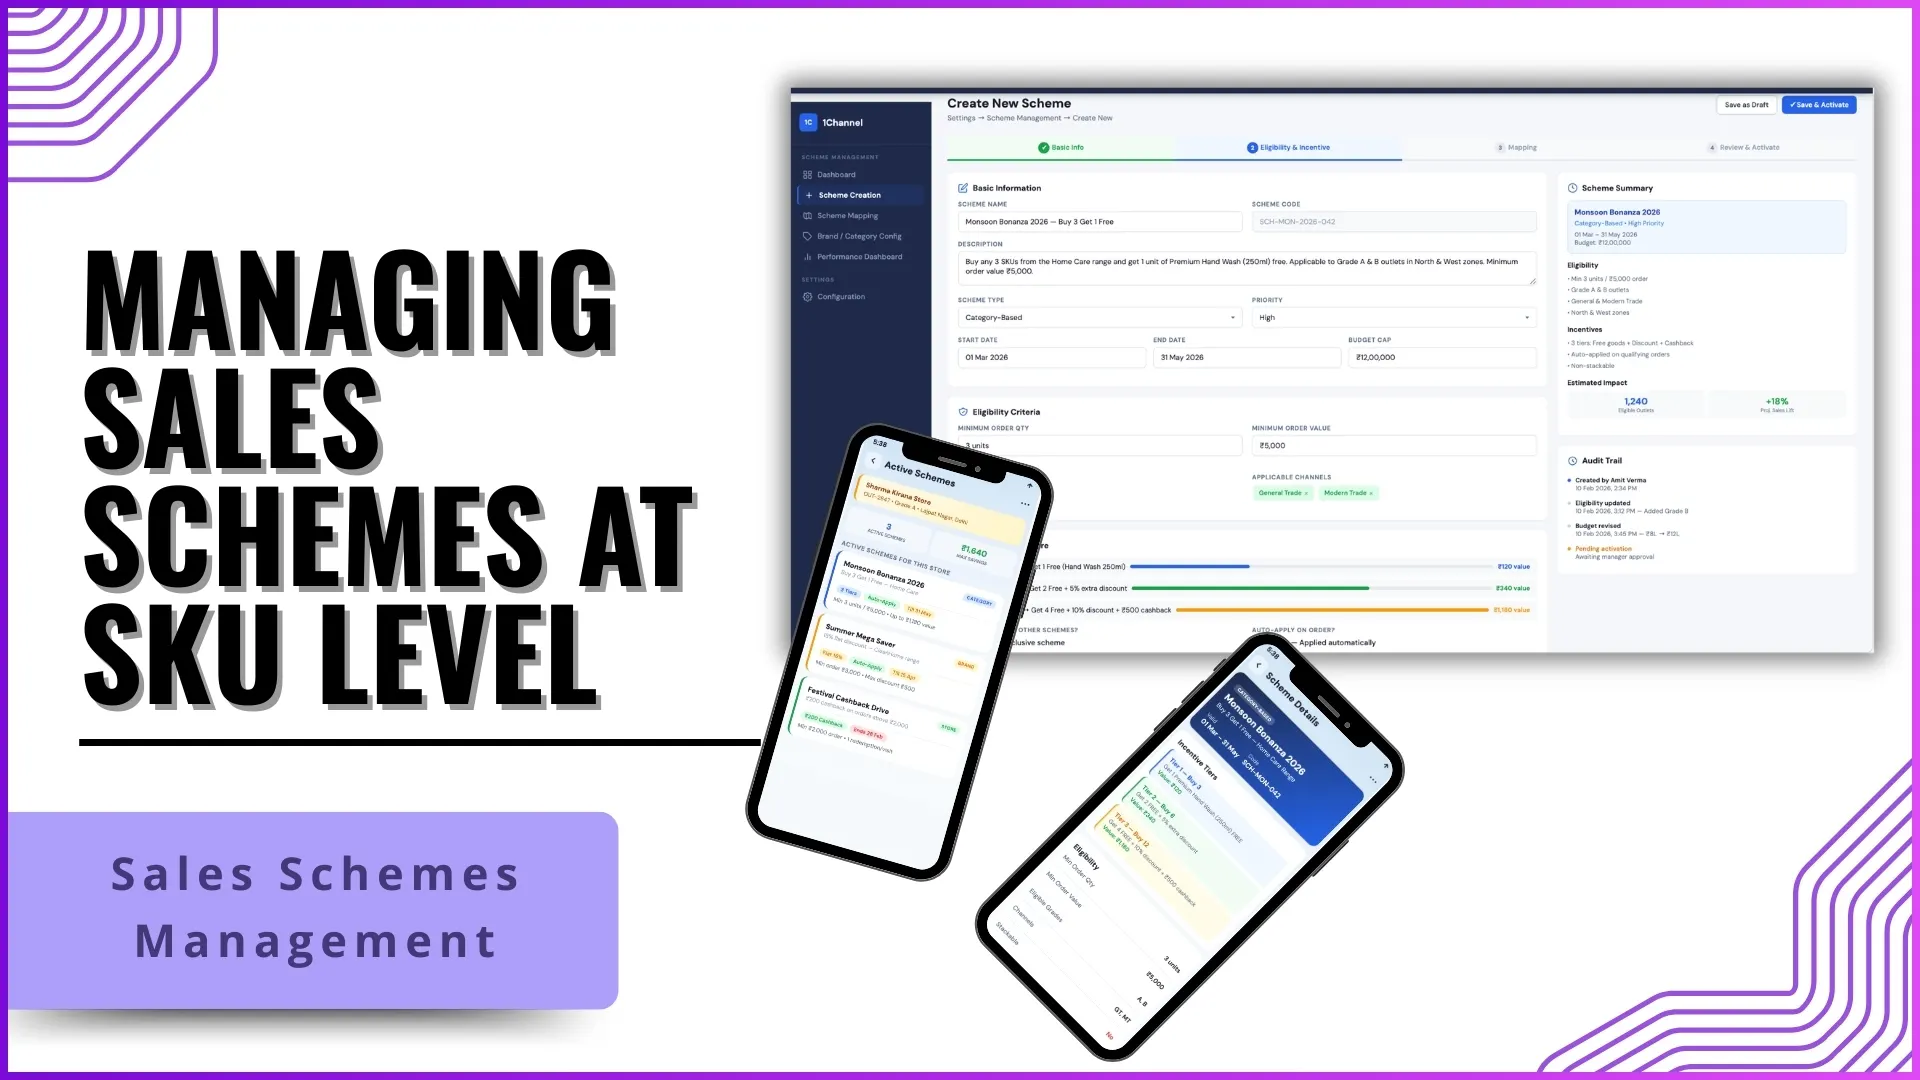
What an MTD Report Captures
An MTD (Month-to-Date) sales report is the running cumulative view of every sale recorded in the cloud SFA from the first of the month through whichever day the report is run. It collapses every transaction, every store, every rep, every SKU, every distributor, into one consolidated view that can be filtered by territory, channel, or product. The point is not to track each transaction one by one. The point is to read the pace, the mix, and the gaps against the month's target while there is still time to act on them in the same cycle.
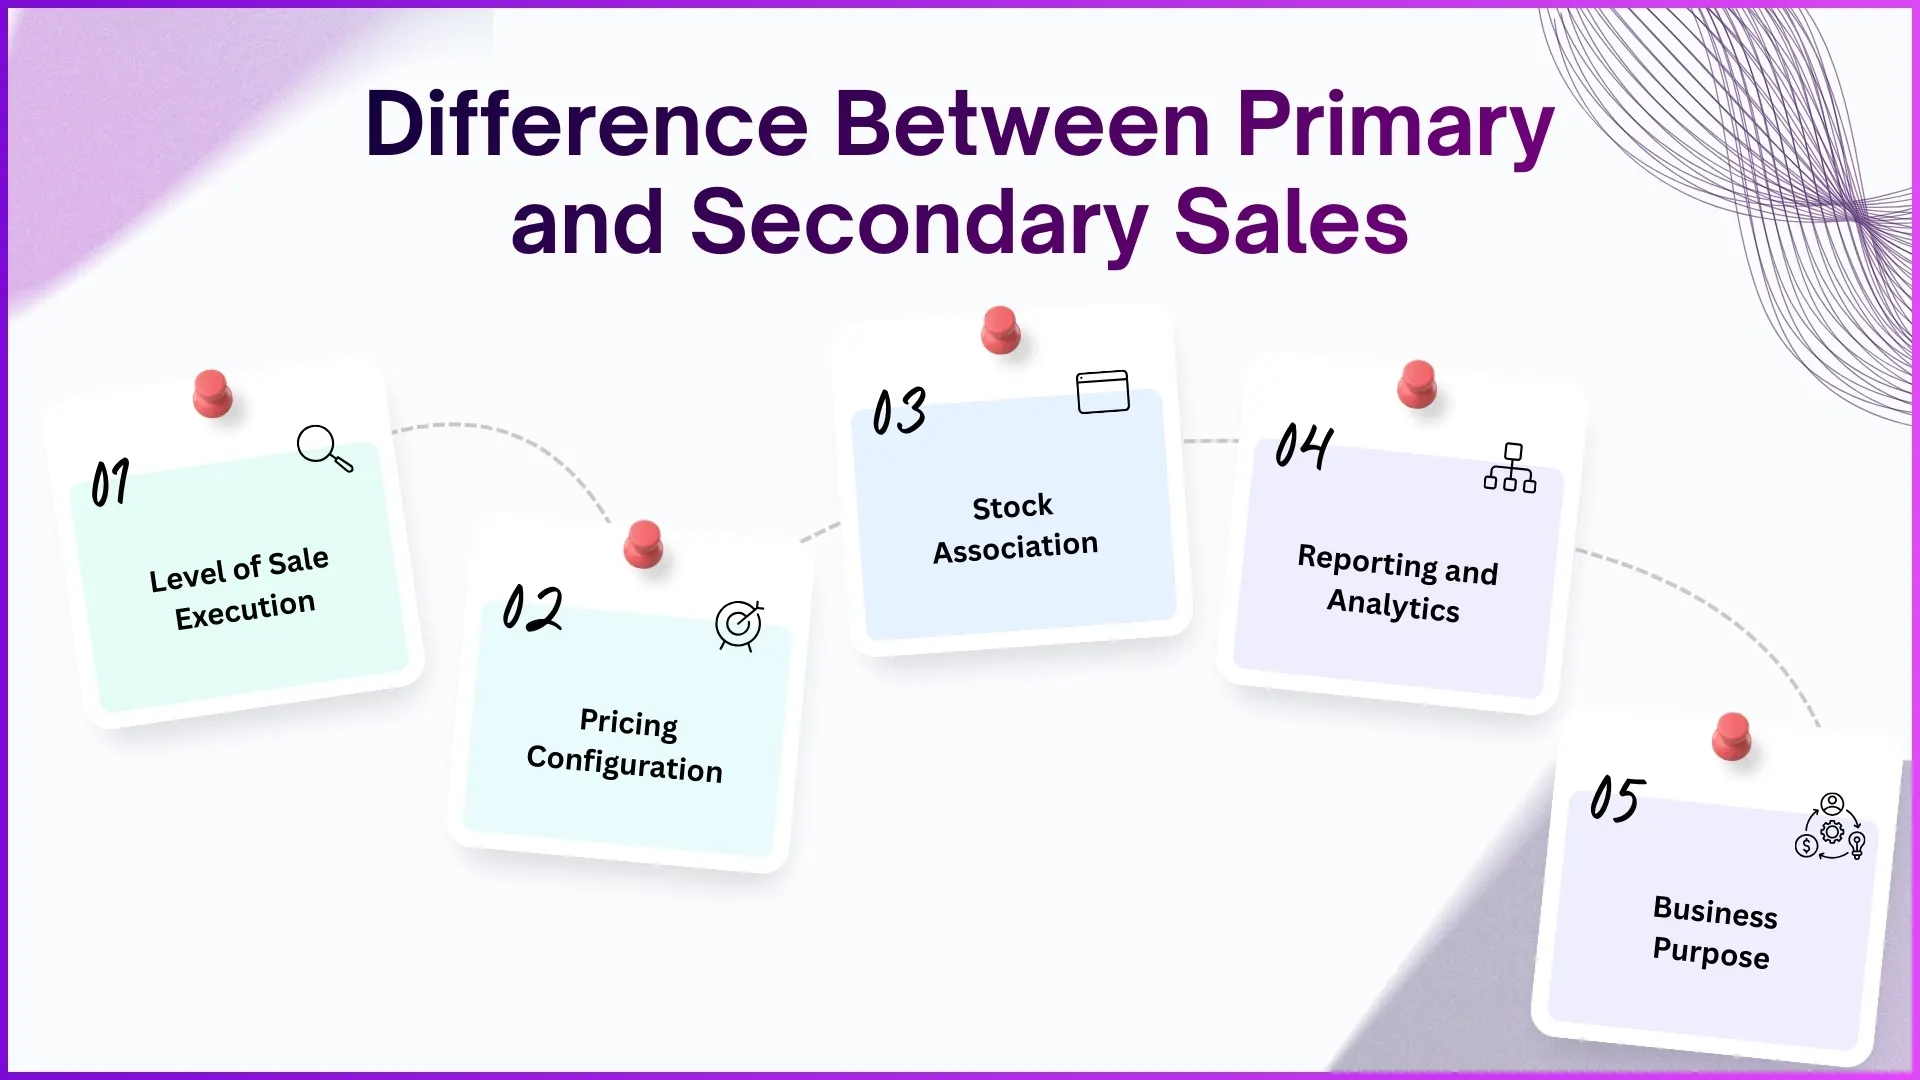
Three MTD Views the Field Operations Team Relies On
The cloud SFA produces three distinct MTD views, each answering a different operational question.
MTD Tertiary Sales
Cumulative sales from retailers to end consumers. The view answers "what is moving through to the shopper?", the truest indicator of demand for the period. Reported by SKU and value, with drill-down to store and rep.
MTD Secondary Sales
Cumulative sales from distributor to retailer. The view answers "what is the channel pulling?", useful for planning supply and replenishment to the trade. Reported by distributor and SKU.
MTD Sales by Product Category
Cumulative rollup at the category level rather than the SKU level. The view answers "which category is carrying the month?", useful for marketing and brand teams deciding which categories need an extra push.
Where Mid-Month Decisions Get Made From the Report
The MTD report is most valuable in the second half of the month, when there is still room to course-correct but enough data to know what is off. The cloud SFA's report layer surfaces three deviations the operations team typically watches. First, pace deviation, the run rate compared to the linear target. A territory tracking 35% of target by day 20 needs intervention. Second, mix deviation, the SKU or category mix tilting away from the planned mix, which can hint at a competitor promotion or a stock-out somewhere in the channel. Third, distributor concentration, when a small set of distributors carry more than the planned share, exposing the program to single-source risk. The platform's automation flags each deviation as it forms, so the conversation happens early rather than at month-end review.
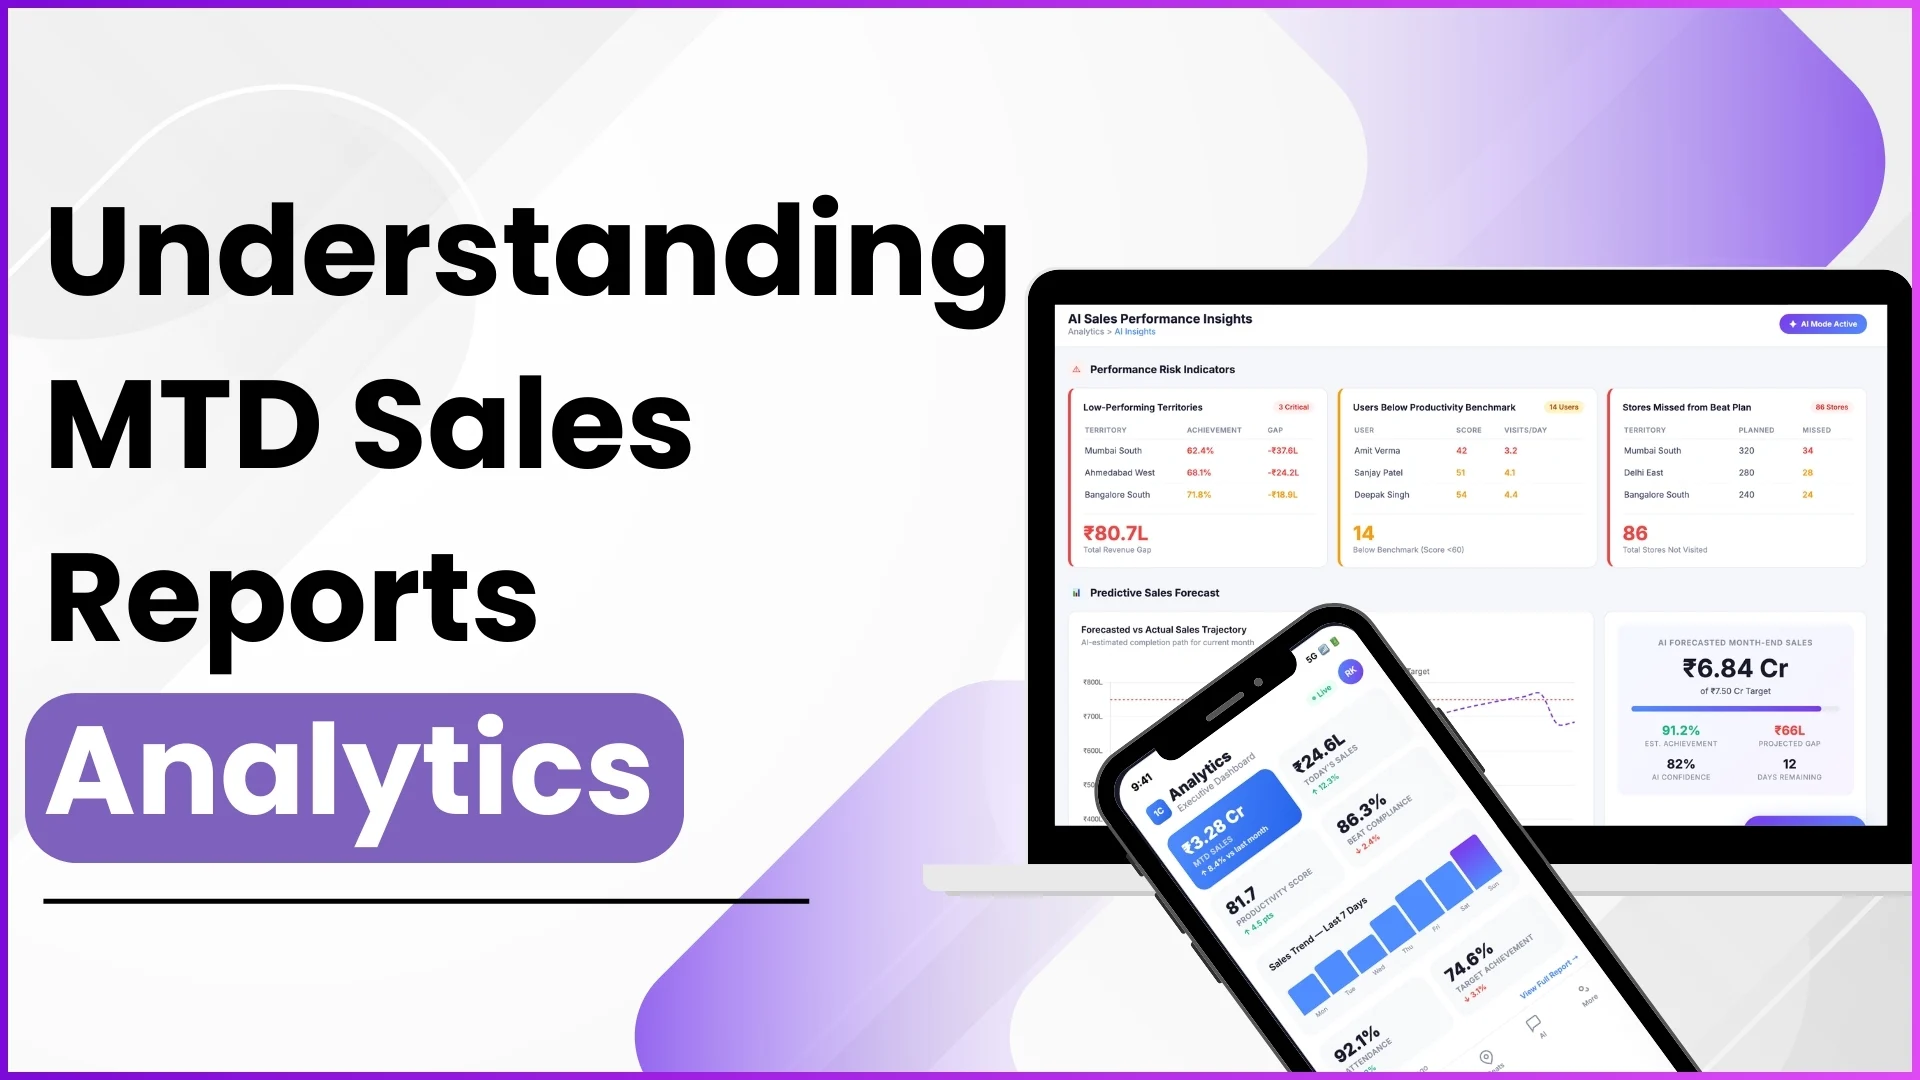
How 1Channel Builds MTD Reports That Drive Decisions
1Channel's cloud SFA generates MTD reports in the platform's Analytics module. Tertiary, secondary, and category-level views refresh on a continuous basis, so the dashboard a regional manager opens at 11 AM reflects orders captured up to that moment. 1Channel's AI engine ranks deviations against targets and historical patterns, flagging the territories that need attention before the manager has to scroll the report. A custom report builder configures the slice, by region, by brand, by channel, by territory, and the operator can export the view to Excel for offline analysis when needed. The audit log records every change to the report definition, so the team can trust the comparability across cycles. Role-based access ensures each user sees the slice that matches their accountability.
Explore Sales Analytics Software
1Channel's cloud sales analytics surfaces MTD tertiary, secondary, and category pace with AI-ranked deviation flags for Malaysian sales teams.
Explore Sales Analytics Software →Quick Recap
The MTD sales report is the field organization's working dashboard for the open month. It collapses tertiary, secondary, and category-level sales into a single view that updates continuously, so leadership reads the pace, the mix, and the concentration at a glance rather than waiting for an end-of-month roll-up that arrives after the period has closed.
What makes the report operational is the second half of the month: the gap between the run rate and the target is still actionable, and the cloud SFA's automated AI flagging makes sure the operator does not have to find the deviation themselves. The same report that closes the month at month-end is the same report that decided which actions ran in the last ten days. That continuity is the value worth defending in the report design from the start.