A consumer electronics company in Kuala Lumpur has 60 field promoters deployed across hypermarkets and retail chains in Selangor. On a given Tuesday, the attendance report shows that 55 out of 60 promoters reported attendance, a 91.7% reporting rate. The operations manager looks at this number and assumes the day is well covered.
But reporting attendance and being present are not the same thing. Of those 55 who reported, 8 marked themselves as "on leave," 3 selected "half-day," and 2 used the "on-duty" status for an internal training session. That leaves 42 promoters actually present at their assigned outlets, resulting in a present attendance percentage of just 70%.
The difference between 91.7% and 70% is the difference between a number that looks good on paper and a number that reflects reality. For any Malaysian business managing distributed field teams, understanding and monitoring this distinction is essential for honest operational decision-making.
Table of Contents
Reporting Percentage vs Present Percentage: Why the Distinction Matters
Every SFA attendance system captures two fundamentally different metrics, and conflating them leads to flawed decisions.
Attendance reporting percentage measures how many employees submitted any attendance action, present, leave, half-day, on-duty, or any other configured status. It tells you who interacted with the attendance system.
Present attendance percentage measures how many employees specifically marked themselves as "Present" and are expected to be actively working in the field. It tells you who is actually on the ground.
Consider what happens when a manager relies only on reporting percentage:
- A team showing 95% reporting rate might have only 75% actual presence after accounting for leave, half-days, and non-field statuses
- Territory coverage calculations based on reporting percentage overestimate how many outlets will be visited
- Payroll processing that uses reporting percentage instead of present percentage can result in overpayment for days not actually worked in the field
The present attendance percentage strips away these distortions and gives managers a clean view of real field workforce participation.
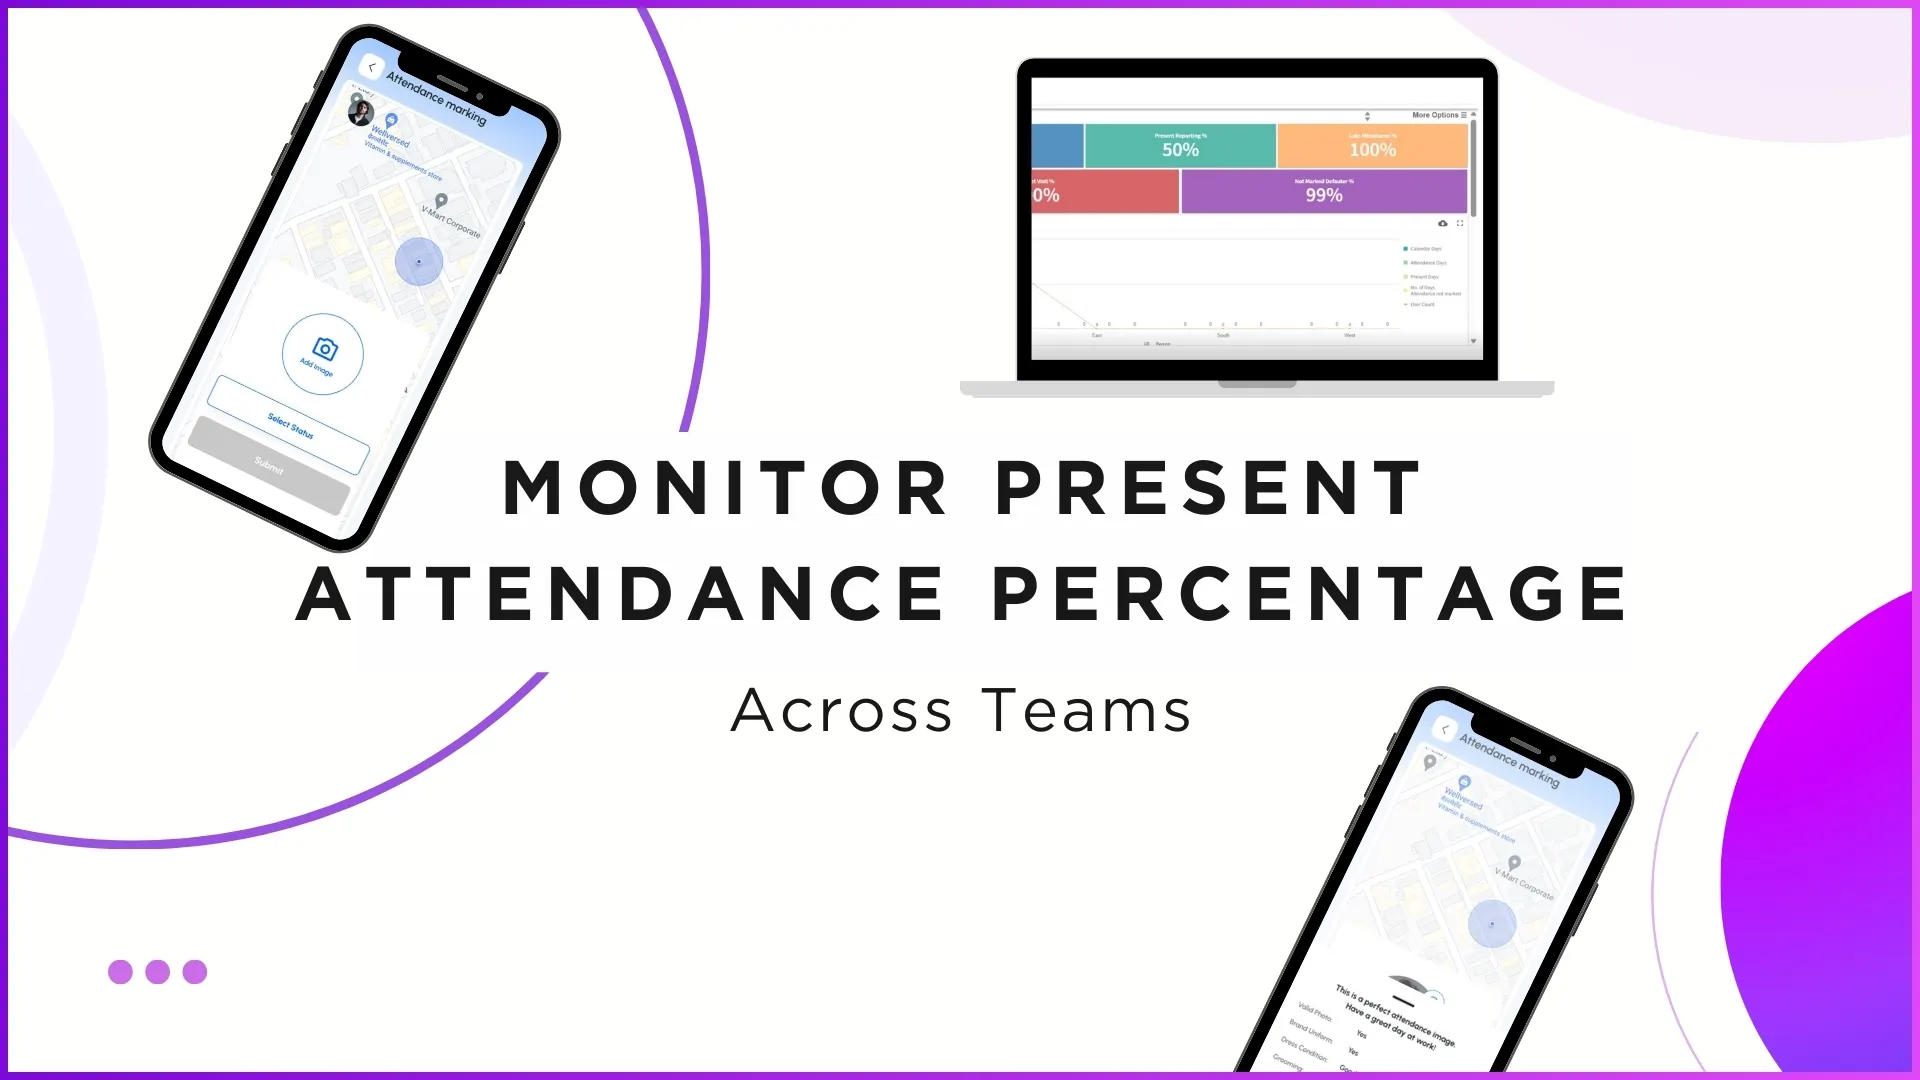
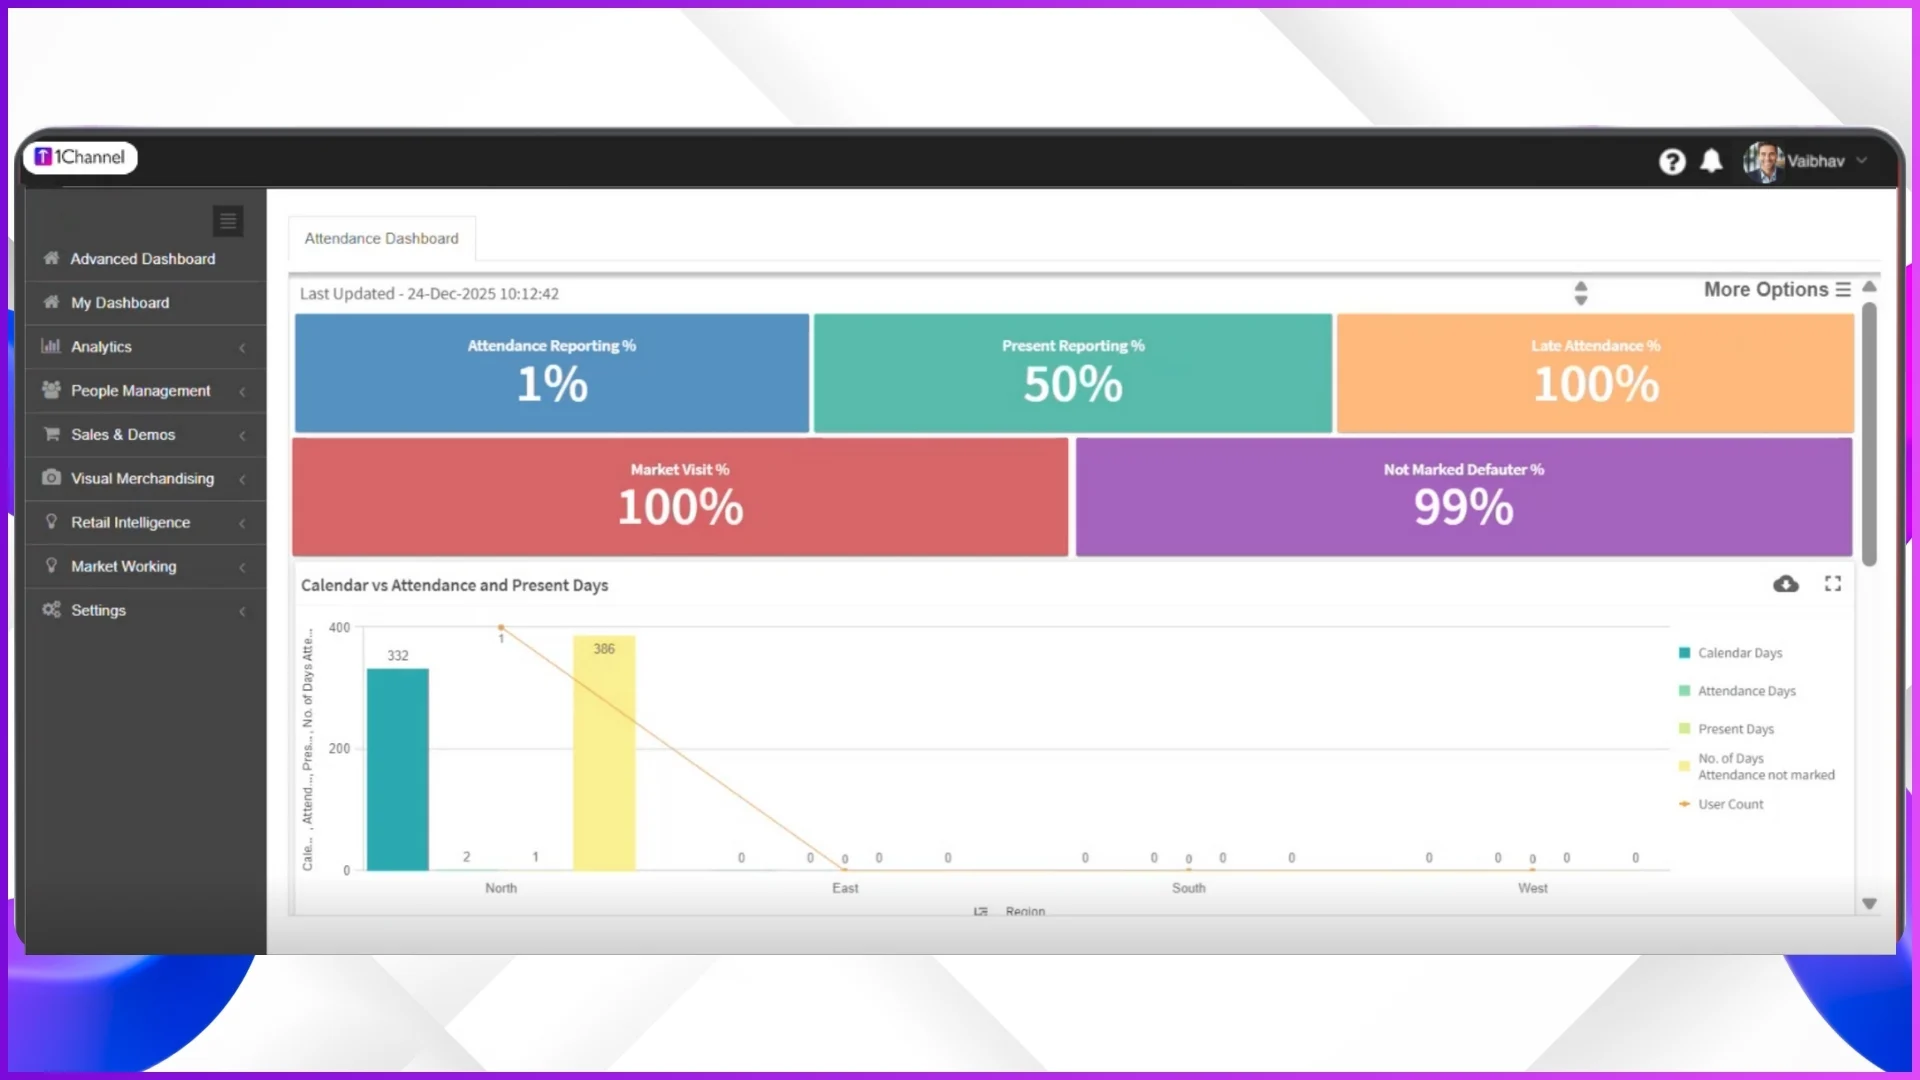
Where This Metric Appears in the SFA Dashboard
Present attendance percentage is surfaced as a primary KPI on the SFA advanced dashboard, the first screen managers see when they log into the portal. It sits alongside related metrics including attendance reporting percentage, late attendance percentage, market visit percentage, and not-marked defaulter counts.
The placement is intentional. By showing present percentage on the landing screen, the system ensures managers engage with real field presence data before diving into any other operational module. There is no need to navigate to a separate report or download an Excel file. The number is there the moment the portal loads.
How to Compare Present Attendance Across Teams and Territories
For organisations with field teams spread across multiple regions, the value of present attendance percentage increases when you can compare it across segments. The SFA dashboard supports this through configurable filters:
By Territory or City
A national sales manager can filter present attendance by state or city to compare field presence across Klang Valley, Johor Bahru, Penang, Kuching, and Kota Kinabalu. If Penang consistently shows 85% present attendance while Johor hovers at 68%, that gap demands investigation, is it a staffing issue, a management issue, or a market-specific challenge?
By Role
Different roles have different attendance expectations. Promoters stationed at fixed retail outlets should have near-100% present attendance on scheduled days. Field sales executives covering multiple outlets per day may have slightly lower rates due to travel and scheduling variability. Comparing present percentage by role reveals whether each team is meeting its specific attendance benchmarks.
By Reporting Manager
Filtering by reporting hierarchy shows whether attendance discipline correlates with management. If Team Leader A's group maintains 92% present attendance while Team Leader B's group sits at 74%, the data points to a first-line management issue rather than an organisation-wide problem.
By Time Period
Viewing present attendance over weekly, monthly, or quarterly windows reveals trends that daily snapshots miss. A team might show acceptable daily numbers but a declining monthly trend, dropping from 88% in March to 79% in May, which signals emerging issues before they become critical.
Drilling Down to Individual Employee Data
Summary percentages identify where problems exist. Employee-level data identifies who is contributing to those problems, and who is performing well.
The attendance compliance table provides a row for each employee with columns including:
- Employee code and name that provides unique identification for cross-referencing with HR and payroll systems
- Role that provides promoter, team leader, area sales manager, or any configured designation
- Assigned city or territory that provides where the employee is expected to operate
- Calendar working days that provides total business days in the selected period
- Present days that provides days specifically marked as present
- Present attendance percentage that provides present days divided by calendar days, expressed as a percentage
- Late attendance count that provides number of days the employee marked attendance after the configured deadline
- Missed and defaulted days that provides days with no attendance action at all
A manager reviewing this table can immediately see that Promoter A in Shah Alam has a 96% present rate with zero late days, while Promoter B in Petaling Jaya has 71% present rate with 4 late days and 2 defaults. The conversation with each promoter is informed by specific data rather than general impressions.
Three Practical Scenarios Where Present Percentage Changes Decisions
Scenario 1: FMCG Merchandising Coverage
An FMCG company assigns 20 merchandisers to cover 180 hypermarket outlets across Klang Valley. Each merchandiser is scheduled to visit 9 outlets per day. When the reporting percentage shows 90% (18 out of 20 reported), the operations team assumes 162 outlets will be covered.
But present percentage shows only 80% (16 actually present). Two merchandisers reported "on leave" status. The real coverage capacity is 144 outlets, 18 outlets short. Without tracking present percentage, those 18 outlets would have been assumed covered until end-of-day reports reveal the gap.
With present percentage visible at 9 AM, the operations team can reassign routes to cover high-priority outlets before the day progresses.
Scenario 2: Pharmaceutical Rep Territory Compliance
A pharmaceutical company has 15 medical reps covering clinics and hospitals across Northern Malaysia, Penang, Kedah, and Perak. The weekly present attendance percentage shows Perak at 65% while Penang and Kedah are both above 85%.
Investigating the Perak data reveals that two reps consistently take Mondays and Fridays off, reducing weekly present percentage. The territory manager uses this data to have specific conversations and adjust scheduling, rather than assuming Perak is simply harder to cover.
Scenario 3: Payroll Dispute Resolution
During payroll processing, a rep in Johor disputes that they were marked absent for 3 days in April. The attendance compliance table shows exactly which dates were marked as present, which were leave, and which had no attendance action. The GPS and photo records from AI-validated attendance on present days confirm the data. The dispute resolves in minutes rather than days of back-and-forth between the rep, manager, and HR.
Explore Sales Force Automation
1Channel's cloud-based SFA includes real-time attendance dashboards with present percentage tracking, AI-validated check-ins, role-based analytics, and automated compliance reporting.
Explore SFA Solutions →What Present Attendance Percentage Affects Downstream
Present attendance percentage is not an isolated metric. It feeds into multiple operational calculations within the SFA platform:
Beat Plan Coverage Accuracy
Coverage projections use present attendance as the baseline. If 50 reps are present today, the system calculates expected outlet coverage based on 50 active reps rather than 55 who merely reported. This prevents the common problem of planned coverage falling short because non-present reps were included in the calculation.
Productivity Benchmarking
Sales productivity metrics (revenue per rep, visits per rep, orders per rep) are meaningful only when divided by present reps rather than total headcount. A team of 30 that generates RM 500,000 with 25 present looks different from the same team generating RM 500,000 with all 30 present.
Expense Validation
Expense claims submitted for dates where the rep was not marked present are automatically flagged. This cross-referencing prevents claims for days the rep was on leave or absent, reducing expense leakage without requiring manual auditing by finance teams.
Payroll Accuracy
Attendance closure reports that feed into payroll use present days as the primary input for calculating working days. Leave days, half-days, and absences are separated and processed according to organisational leave policies. The result is payroll that reflects actual field participation.
Turning Present Percentage into Actionable Patterns
Daily present percentage is useful for immediate decisions. Monthly and quarterly trends are useful for strategic ones. Patterns that the analytics layer surfaces over time include:
- Day-of-week patterns. Present percentage on Mondays and Fridays is typically 5 to 10 percentage points lower than mid-week in many field teams. Quantifying this pattern helps managers determine whether it needs intervention or is within acceptable bounds.
- Post-holiday recovery lag. After extended holidays like Hari Raya or Chinese New Year, present percentage may take 2 to 3 days to return to normal levels. Understanding this pattern allows operations teams to adjust coverage targets for the transition week.
- Tenure-based differences. New hires in their first 90 days often show lower present percentages as they adjust to field routines. Identifying this enables targeted onboarding support rather than blanket disciplinary action.
- Weather and seasonal effects. Monsoon season in East Malaysia (November to March) may correlate with lower present attendance due to flooding and transport disruptions. Historical data helps operations teams plan contingency coverage during these months.
Frequently Asked Questions
What is the difference between attendance reporting percentage and present attendance percentage?
Attendance reporting percentage counts everyone who submitted any attendance action, present, leave, half-day, on-duty, or any other status. Present attendance percentage counts only those who marked "Present" and are expected to be actively working in the field. Reporting tells you who used the system. Present tells you who is on the ground.
Can present attendance percentage be viewed at the team level and the individual level?
Yes. The SFA dashboard shows aggregate present percentage for the entire organisation, and supports filtering by territory, city, role, and reporting manager. The compliance detail table provides individual employee rows with their specific present percentage, late counts, and missed days.
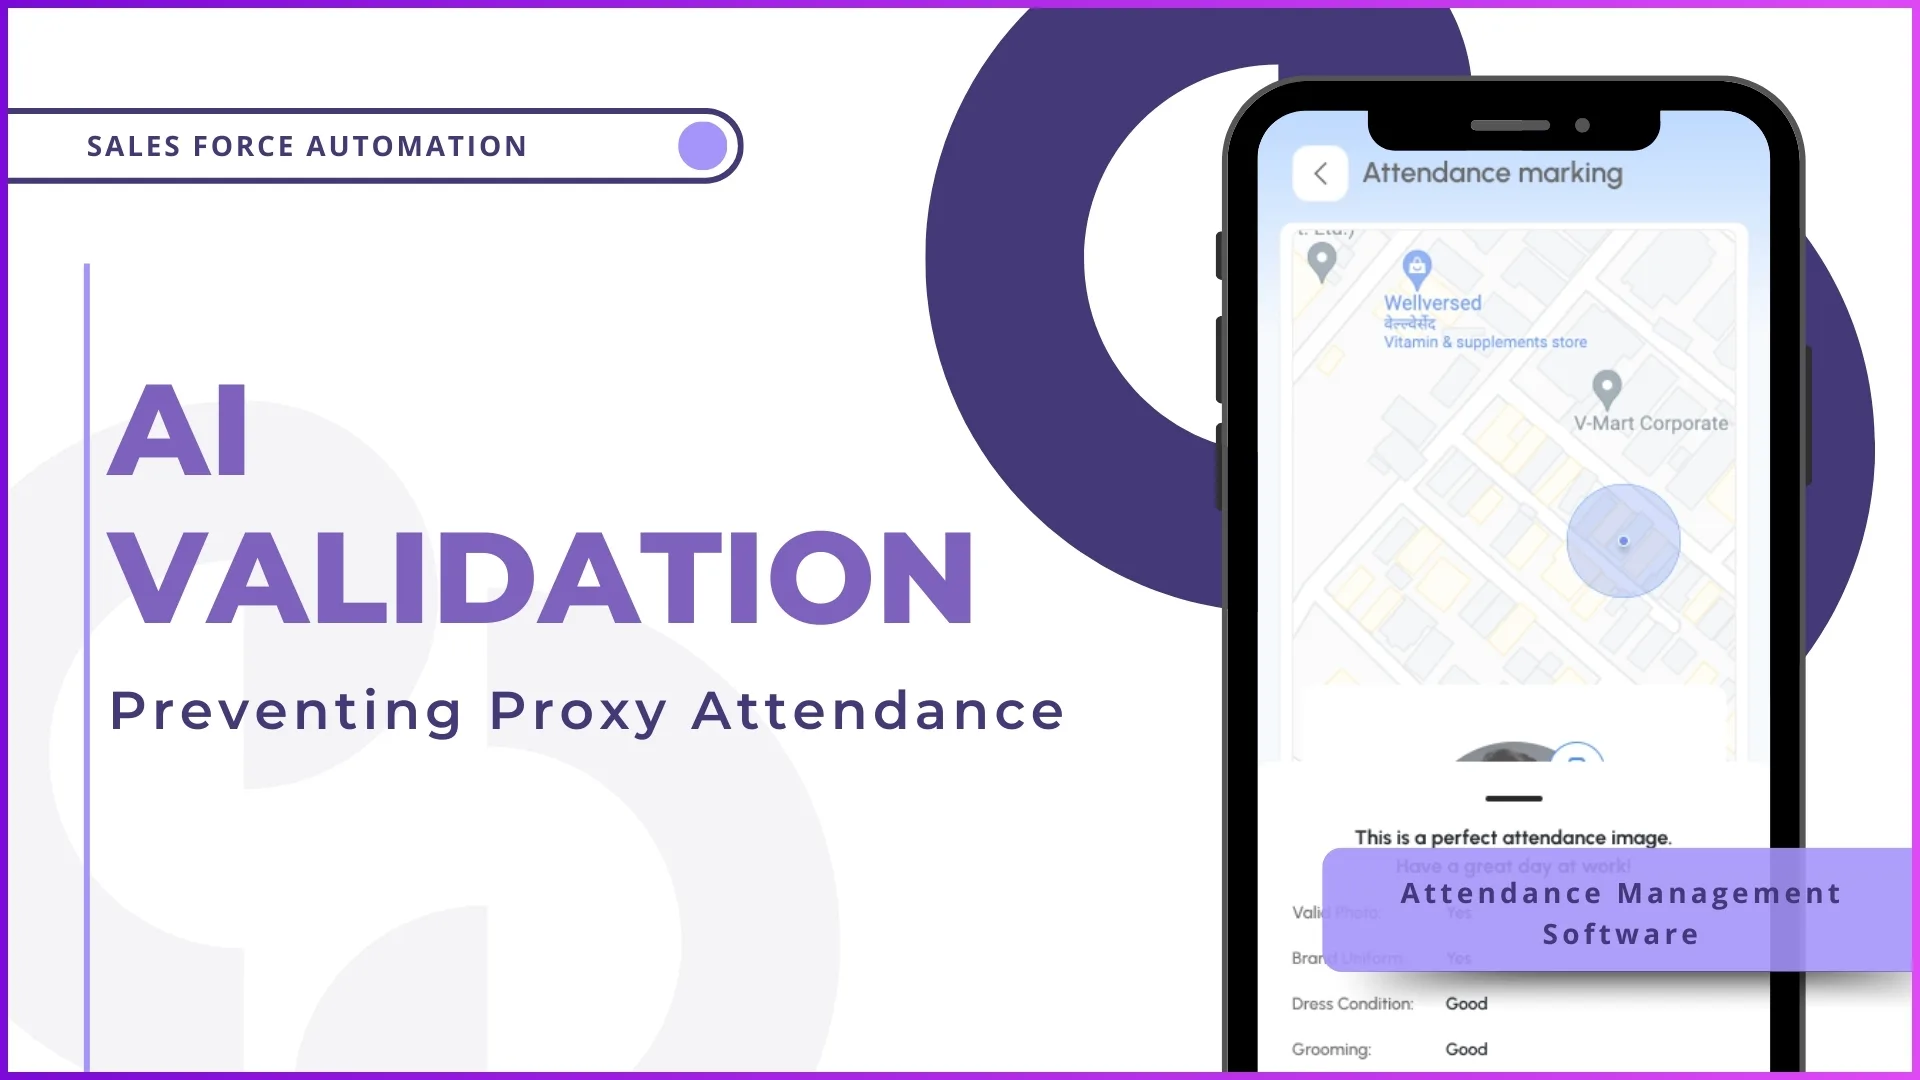
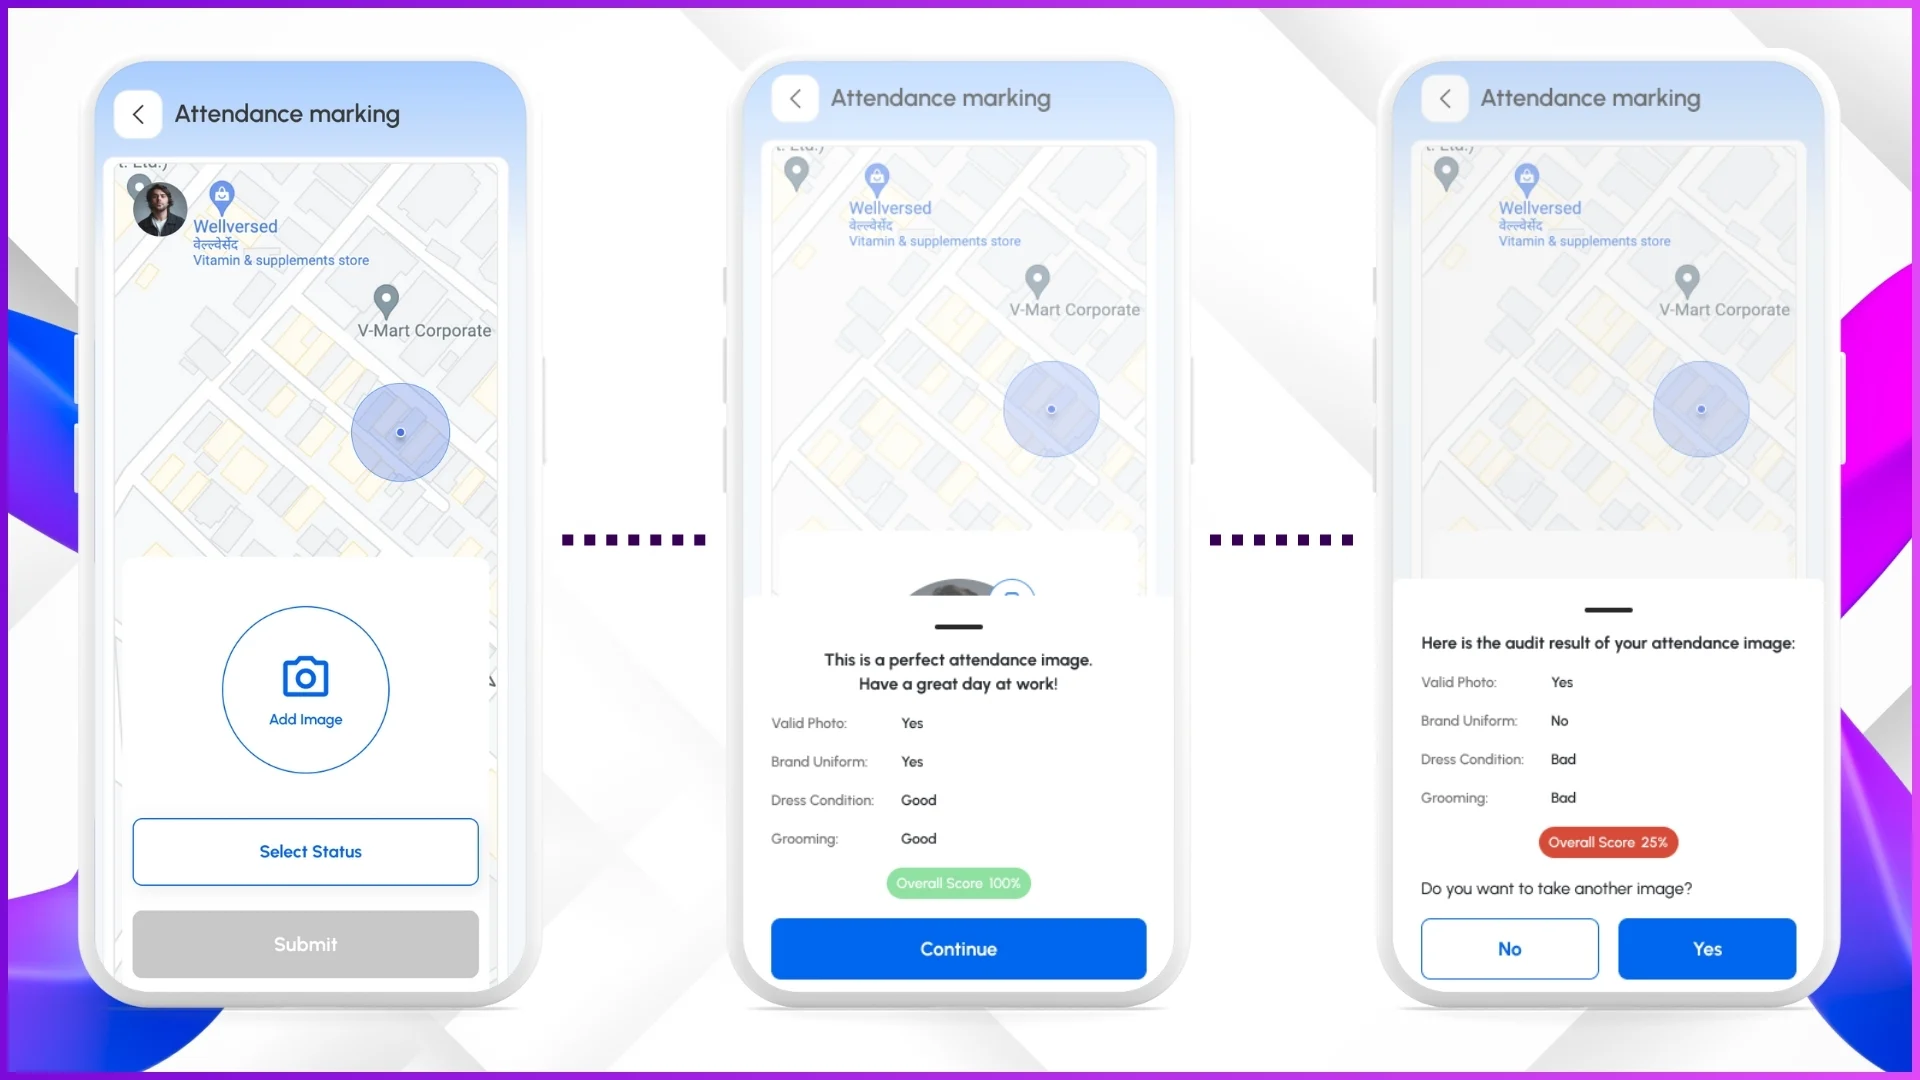
How does AI validation connect to present attendance percentage?
When AI face validation is enabled, every "Present" status includes a verified selfie matched against the employee's reference photo, plus GPS coordinates. This means the present percentage is not just self-reported. It is identity-verified and location-confirmed, significantly increasing the reliability of the metric.
Can the system alert managers when present percentage drops below a threshold?
The dashboard displays present percentage in real time. Organisations can configure notification workflows that trigger alerts when present attendance for a team or territory falls below a defined threshold. For example, notifying a regional manager if Johor drops below 75% present by 10 AM.
Does present attendance percentage account for approved leave?
Employees on approved leave are counted in the reporting percentage (because they submitted a leave status) but excluded from the present percentage calculation. This ensures present percentage reflects actual field availability without penalising employees for legitimate, approved absences.
Final Word
Attendance reporting tells you that the system is being used. Present attendance percentage tells you that the field is being covered. For Malaysian businesses managing sales teams, merchandisers, medical reps, or service technicians across multiple states and territories, this distinction is the difference between operational visibility and operational illusion.
The organisations that track present percentage consistently are the ones that catch coverage gaps at 9 AM instead of 6 PM, resolve payroll disputes with data instead of arguments, and make staffing decisions based on real field participation instead of inflated reporting numbers.
Monitoring present attendance percentage is not about surveillance. It is about making sure the data you use to run your field operations reflects what is actually happening on the ground. Get in touch to see how 1Channel's SFA dashboard tracks real field presence for distributed teams.