A distributor running on 60 KPIs has the same operational visibility as one running on six. The difference is which six the team reads every morning and acts on by lunchtime.
On a long KPI list, every metric carries equal weight and no metric gets the attention it needs. On a short, well-chosen list, the morning review is fifteen minutes and the action queue is clear by noon.
What follows are the twelve distributor KPIs that consistently drive operational decisions in Malaysian distribution, how they roll up, and how dashboards turn them into action.
Table of Contents
Why a Cleaner KPI Set Beats a Longer One
Operations teams that track 60 KPIs read none of them well. The cost of monitoring outweighs the value of the marginal signal.
A clean KPI set forces the team to decide what matters. Sales health, inventory health, order quality, customer engagement, field discipline, financial health: each gets one or two measures, not ten.
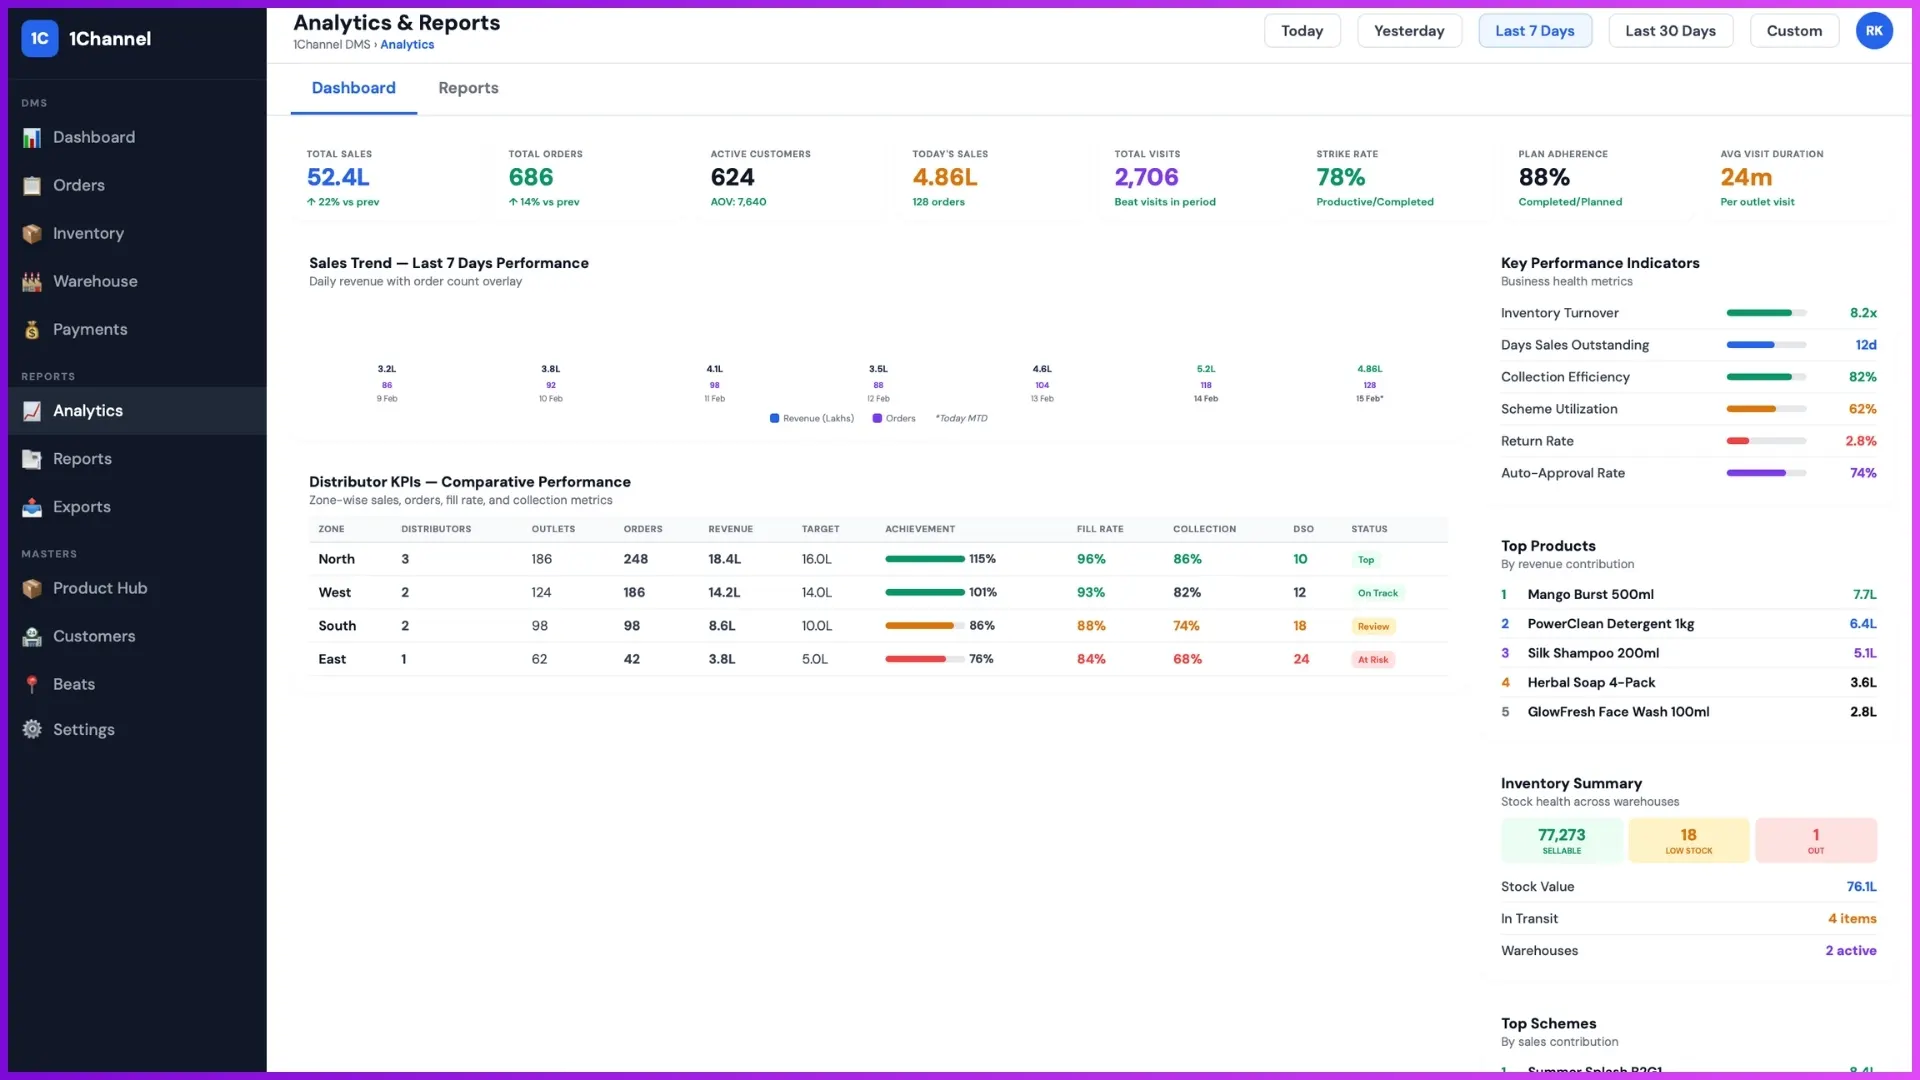
Twelve KPIs the Distributor Operations Team Actually Acts On
Twelve KPIs cover the bulk of what a Malaysian distributor operations team reads daily:
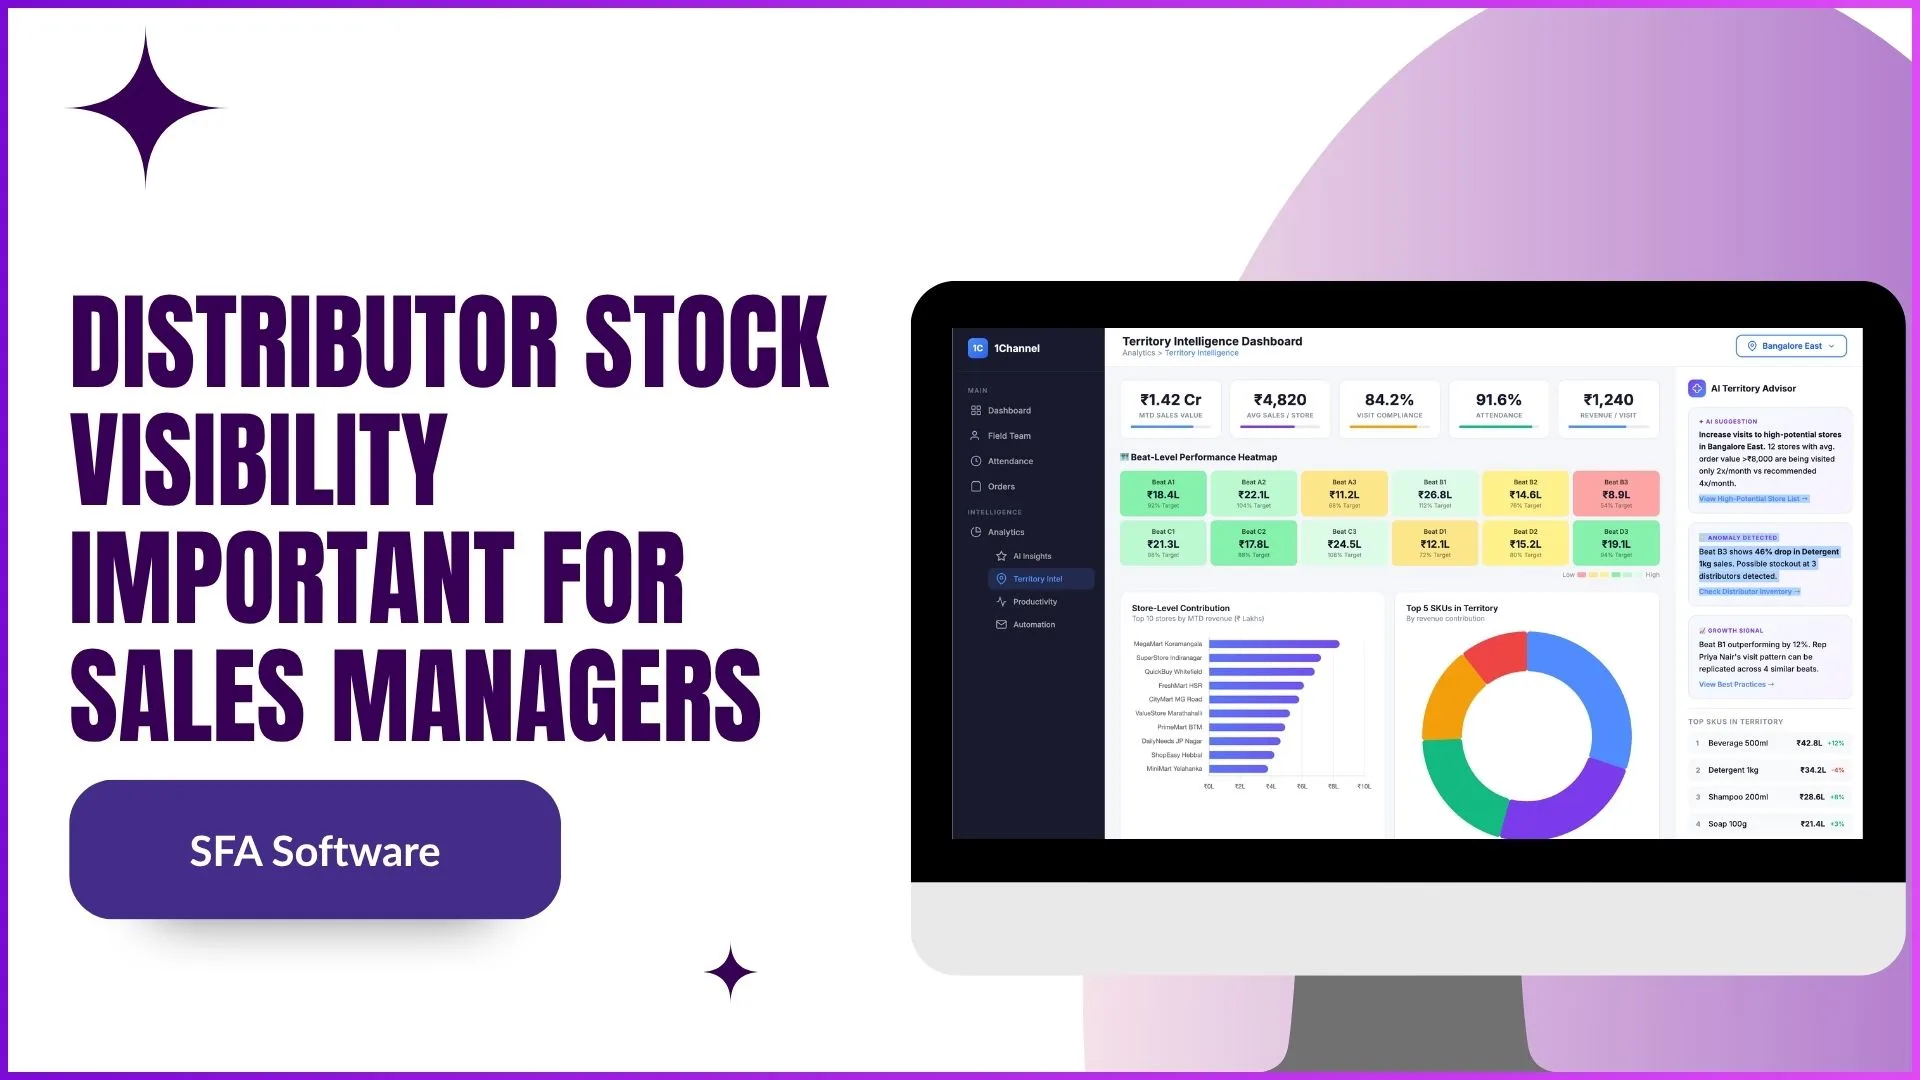
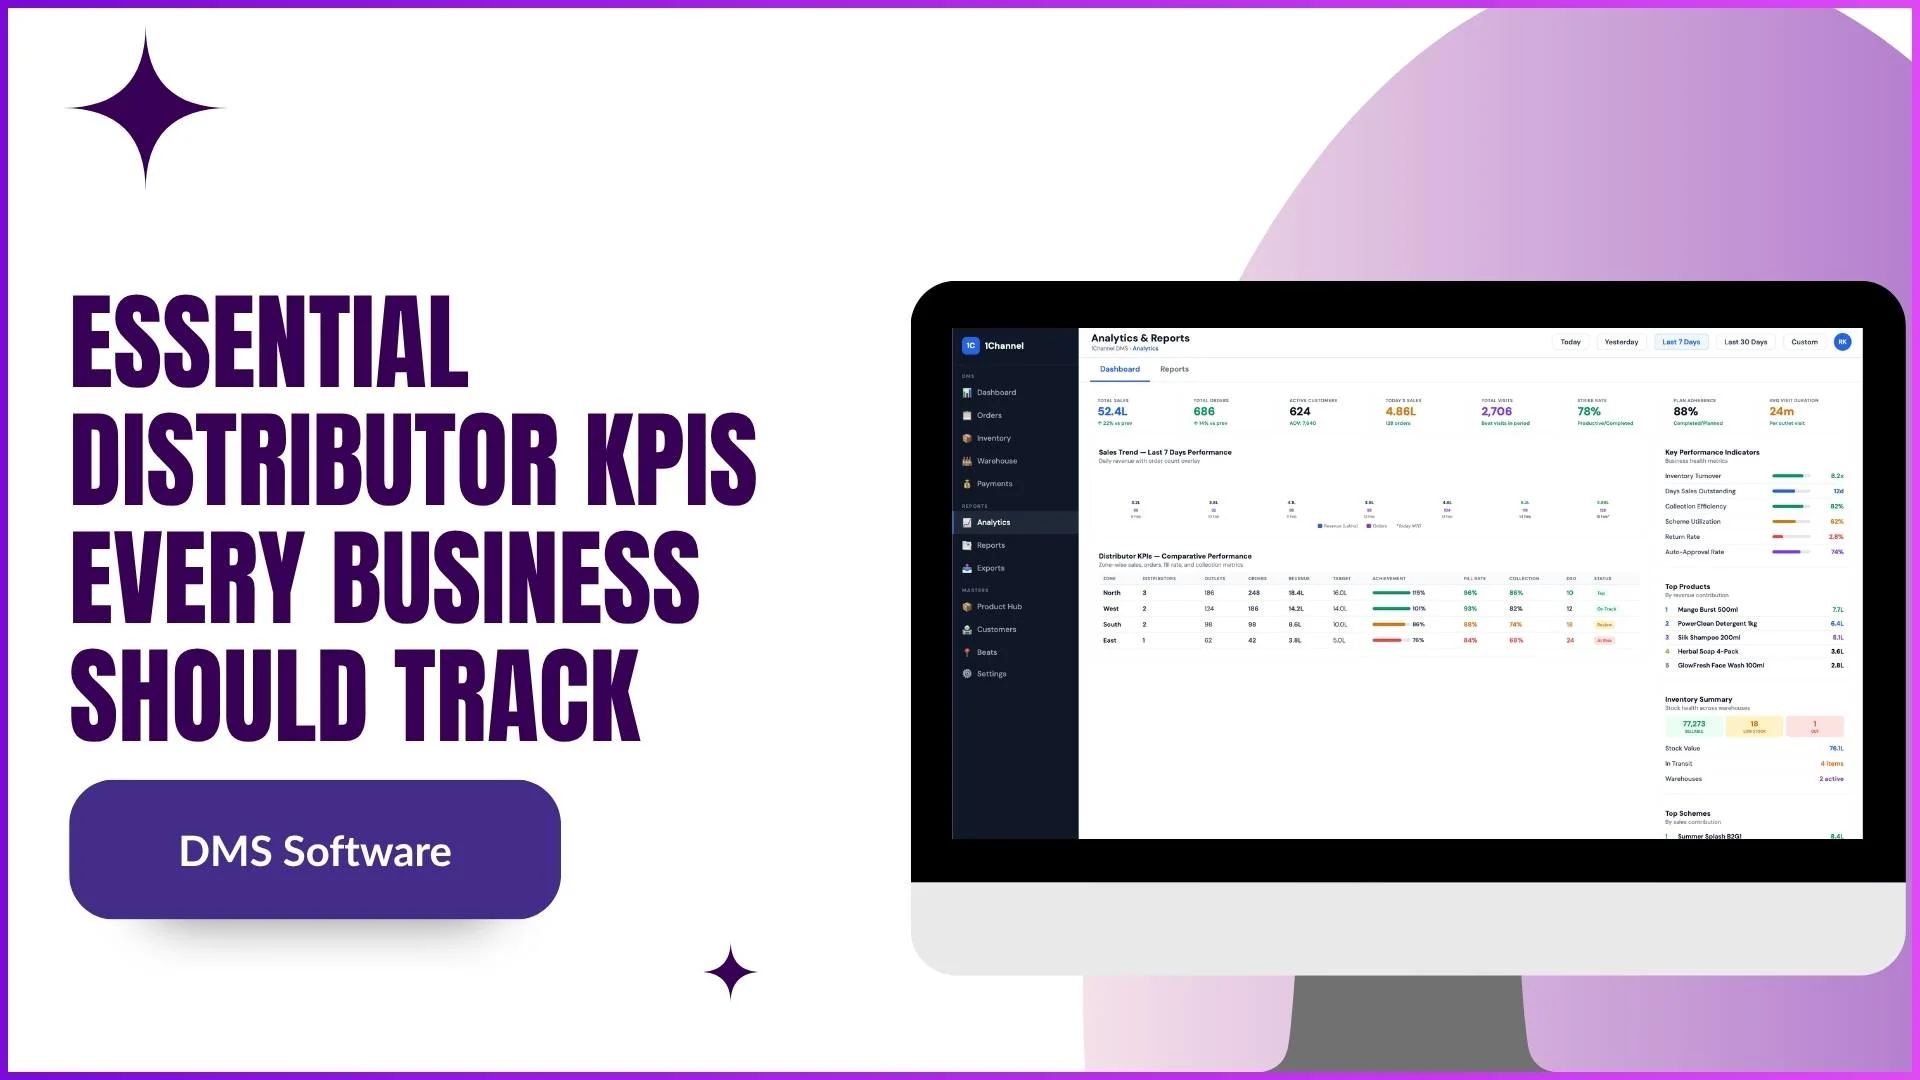
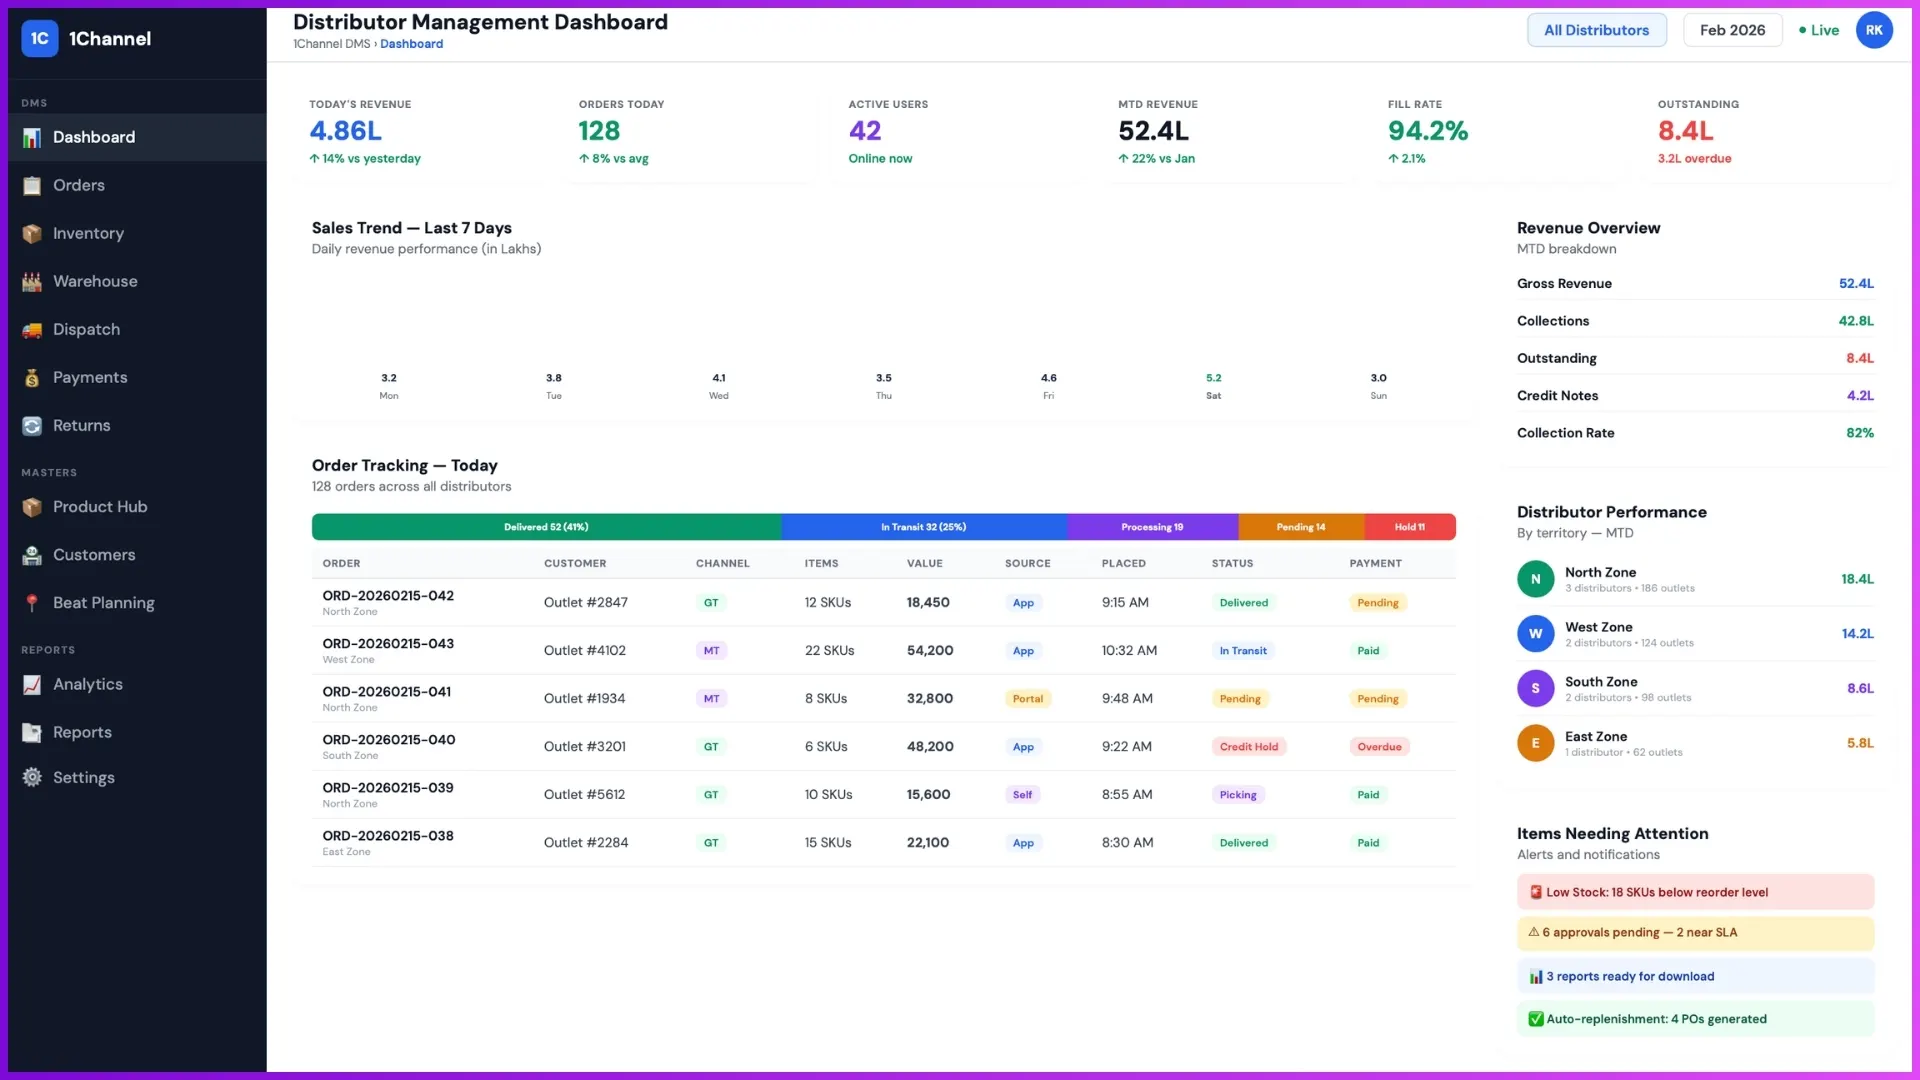
- Sales Performance. Daily sales value against target, broken down by SKU group and territory. The leading indicator the brand reads first.
- Order Management. Order count, fulfilment time, and rejection rate. Proxies operational discipline at the distributor.
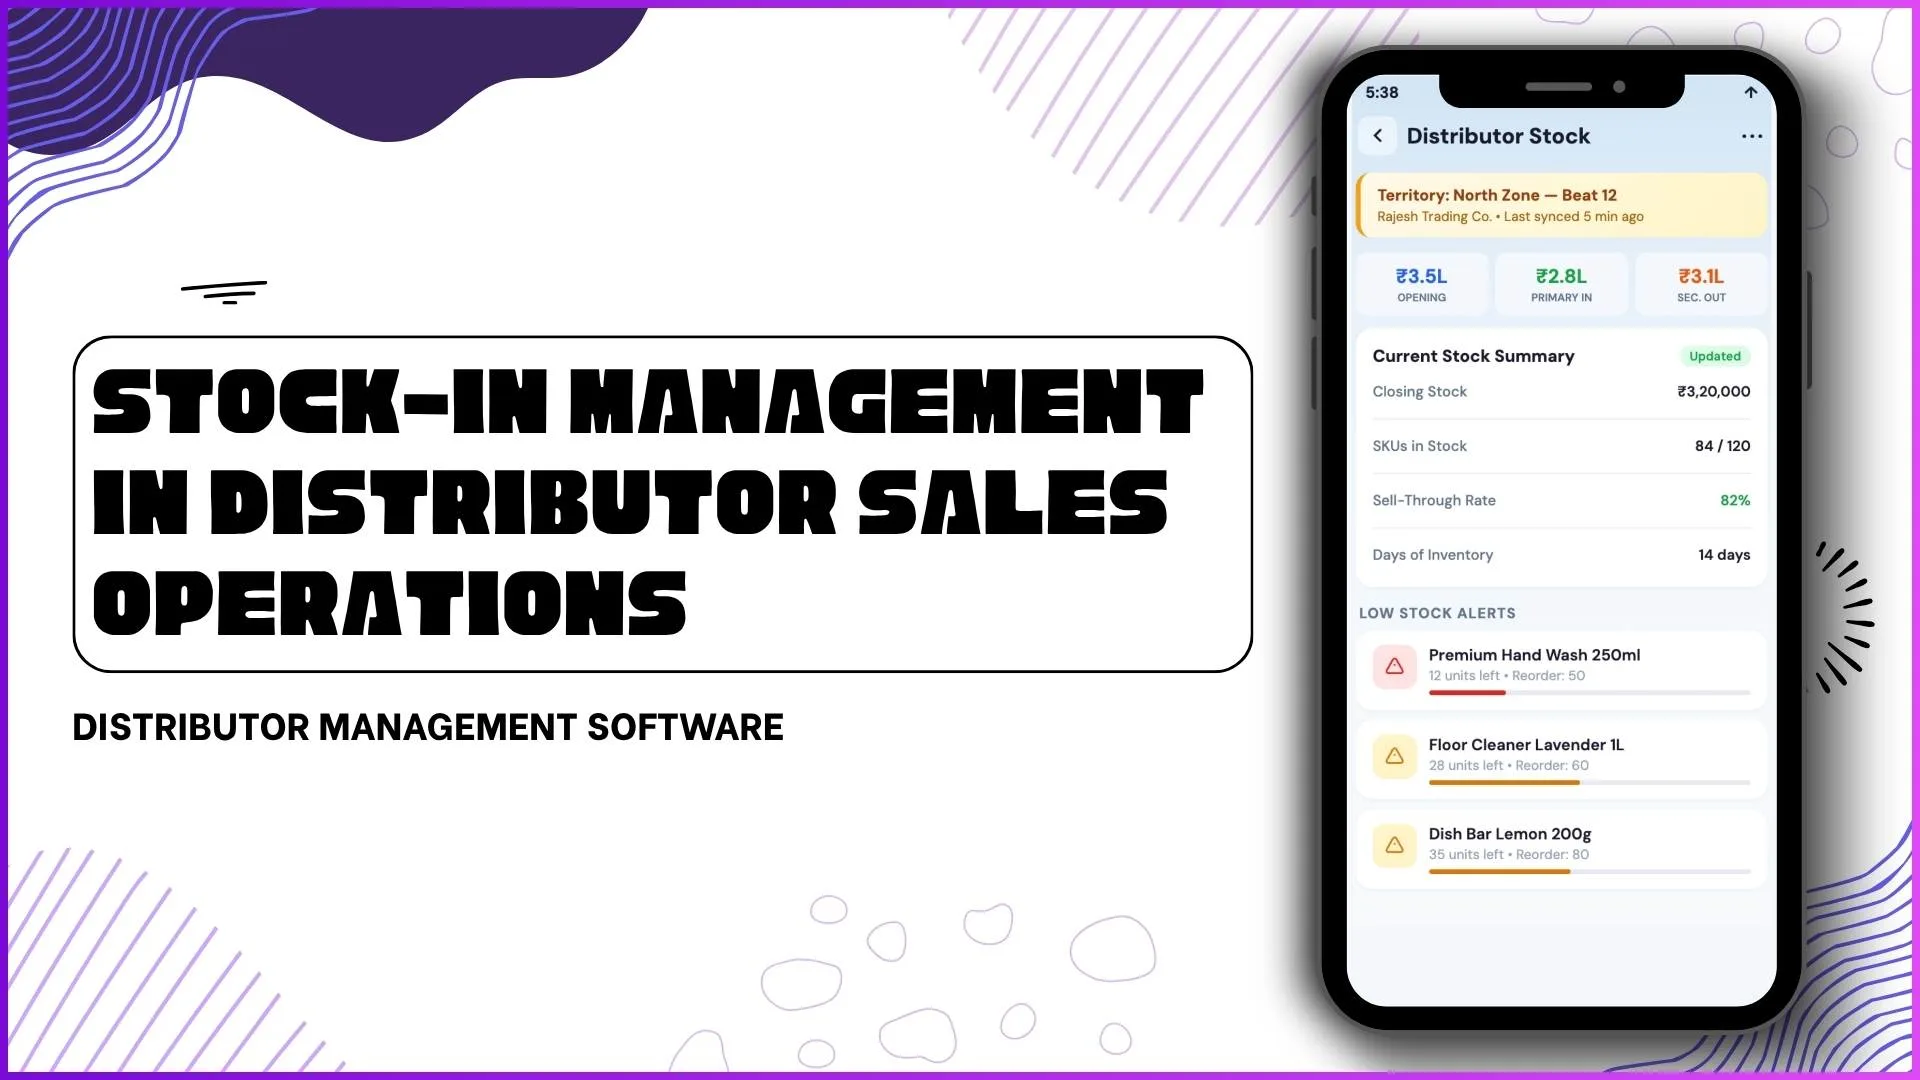
- Inventory Management. Stock value on hand, stock-out incidents, days of inventory. Surfaces the working-capital question.
- Stock Movement. SKU velocity, fastest and slowest movers, and dead-stock identification.
- Product Performance. Per-SKU revenue contribution and margin. Reads which products carry the catalogue.
- Customer Performance. Active customer count, churn rate, and average customer value.
- Field Sales and Beat Performance. Productive call ratio, beat compliance, visit-to-order conversion.
- Target Achievement. Daily, weekly, and monthly achievement against plan.
- Inventory Expiry and Batch. Near-expiry stock value and batch-level visibility.
- Payment and Collection. Days sales outstanding, overdue value, and collection velocity.
- Returns Management. Return rate, return reasons, and processing time.
- Scheme Performance. Scheme uptake rate, scheme value, and ROI per scheme.
How the KPIs Roll Up Into Operational Pictures
Twelve KPIs read as twelve numbers tells the team nothing. Twelve KPIs read as four operational pictures tells the team where to act:
Commercial Momentum
Sales velocity plus inventory days. Tracks whether the demand engine is pulling stock through fast enough.
Operational Discipline
Order fulfilment time plus return rate. Surfaces whether the warehouse and field team are executing cleanly.
Cash Health
DSO plus overdue value. Reads the working-capital position the finance team owns.
Field Execution
Field productivity plus beat compliance. The sharp end of the channel, read live.
How Dashboards Make the KPIs Useful
Raw KPI numbers without a dashboard are spreadsheet rows. The dashboard turns each KPI into a slope, a trend, and an alert.
Good distributor dashboards surface the KPIs grouped by operational picture, with drill-down to the underlying SKU, region, customer, or rep.
How 1Channel Distributor Analytics Surfaces KPI Movement for Malaysian Brands
1Channel runs distributor KPI tracking through its cloud analytics suite. Every transaction, order, stock movement, and scheme execution posts to the same ledger the dashboards read.
1Channel's AI engine watches the KPI patterns for divergence. A distributor whose DSO is climbing past 45 days, a region where scheme uptake is dropping, or a SKU whose velocity has flatlined: all surface as soft alerts before the monthly review.
New KPI definitions, threshold rules, dashboard widgets, and alert recipients go live the same day they are approved, with an automated dry-run preview against the existing distributor base.
Explore Distributor Analytics Software
1Channel's cloud distributor analytics platform surfaces every KPI signal with AI-driven divergence detection and automated alert routing for Malaysian brands.
Explore Distributor Analytics →Outcomes a Distributor Operations Team Can Measure
Five outcomes the team can track once the KPI stack is live:
- Shorter morning review. Twelve KPIs in four operational groups means the daily review fits in fifteen minutes.
- Faster issue surface. Alerts fire when the metric crosses the threshold, not when the report lands at month-end.
- Lower DSO. Cash-health KPIs surfaced live drive faster collection conversations.
- Tighter inventory turn. Stock-movement KPIs prevent dead stock from accumulating beyond rectification.
- Sharper field push. Field execution KPIs route the right conversation to the right supervisor on the right day.