Primary sales, the shipments a distributor books from the brand, can look perfectly healthy on paper for months at a time. Purchase orders are placed on schedule, invoices are settled, and the monthly replenishment target is met without much drama. None of that, on its own, says anything about whether the stock actually moved off the distributor's shelves and into the hands of a sari-sari retailer, a wholesaler's regular buyer, or a modern trade outlet. It only confirms that product changed hands once, from brand to distributor.
Secondary sales are the harder number to see and the one that actually matters: the movement from distributor or sub-distributor to sari-sari stores and other retail outlets across a territory. With an estimated 1.1 million sari-sari stores driving roughly 60% of FMCG sales nationwide, and general trade accounting for something like 63% of grocery distribution against a much smaller modern trade share, this is where real consumer demand is proven or disproven. When secondary sales quietly stall, whether across one route, one region, or one distributor's whole territory, the effect is invisible on a primary sales report. Stock simply piles up in a warehouse, a backroom, or the back of a delivery van, while the headline number keeps looking fine.
A distributor or brand that only tracks primary sales is measuring restocking discipline, not demand. Left unchecked, that gap creates two compounding problems: channel stock inflates without anyone noticing, and every forecast built on primary sales alone is quietly forecasting the wrong thing. Getting secondary sales visibility right, at the outlet, route and territory level, is what turns a primary sales report from a comforting number into an accurate one.
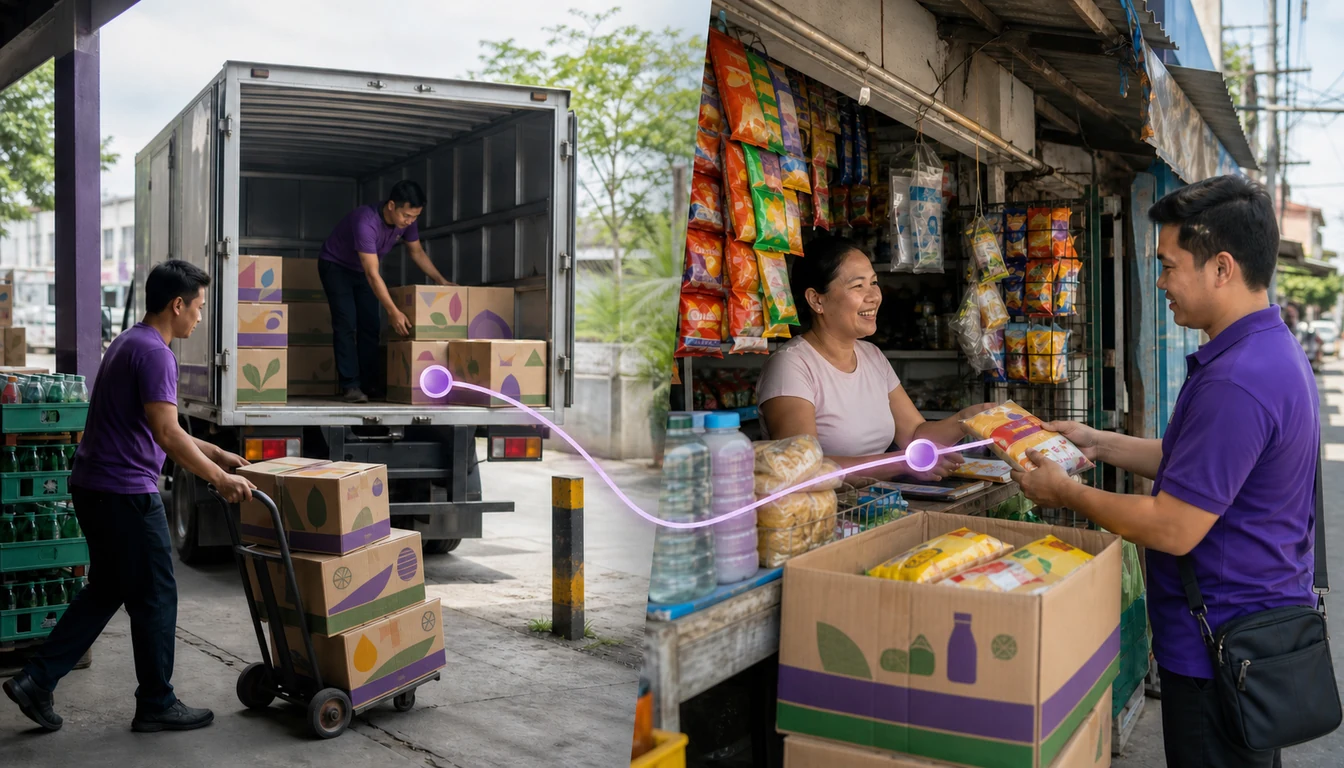
Primary sales vs secondary sales: two different numbers, one true picture
The two terms get used loosely in conversation, but the distinction is precise and worth holding onto, because every downstream decision, from replenishment to trade spend, depends on knowing which number is being discussed.
Primary sales: brand to distributor
Primary sales record the transaction between the brand (or its regional depot) and the distributor. A purchase order is raised, stock is shipped, an invoice is settled. This is the number that shows up first in a brand's own books, and it is genuinely useful for tracking distributor purchasing patterns, credit exposure and fulfilment timelines. What it cannot tell anyone is whether that stock has actually reached a shelf a consumer can buy from. A distributor can book a large primary order to hit a quarterly target or capture a promotional discount, and that order is real and bookable, regardless of what happens to the stock afterwards.
Secondary sales: distributor to sari-sari and retail outlet
Secondary sales record the next transaction in the chain: distributor or sub-distributor to sari-sari store, wholesaler, pharmacy or modern trade counter. This is the number closer to actual consumer offtake, because it reflects an outlet choosing to restock a SKU rather than a distributor choosing to fulfil a target. In a market built around van sales and pre-selling, secondary sales are captured route by route, outlet by outlet, by the field team doing the actual selling, which is exactly why the number is so much harder to assemble into one reliable picture than primary sales ever is.
Why primary sales can look healthy while the channel underneath stalls
The gap between the two numbers is not a data quality problem to be tidied up eventually; it is a structural risk that grows quietly. A distributor chasing a primary sales target, an incentive slab, or a promotional buy-in has every reason to keep ordering from the brand even when the previous batch has not cleared the warehouse. Each of those orders books cleanly as primary sales revenue. Meanwhile the sari-sari stores and retail outlets on that distributor's routes are reordering at their own pace, dictated by tingi-driven, small and frequent restocking, not by the distributor's purchasing calendar.
Over a few cycles, the two lines diverge without anyone deliberately hiding anything. Primary sales stay flat or even climb, because the incentive to keep ordering never goes away. Secondary sales, if anyone were tracking them at the same cadence, would show flattening or falling offtake at the outlet level. Without a way to see both numbers side by side, the brand only sees the first line and reasonably assumes demand is healthy, right up until a distributor's warehouse is full, credit lines are stretched, and a correction becomes unavoidable all at once rather than being caught early and adjusted gradually.
Why secondary sales visibility is hard to get in a sari-sari-heavy market
Getting a reliable secondary sales number is genuinely harder in the Philippines than it would be in a market dominated by a handful of large, centrally billed retail chains, and it is worth being specific about why.
A million-plus small, independent outlets, no unified point-of-sale feed
Sari-sari stores are family-run, typically stocking up to around 200 SKUs in a tiny footprint, and they do not run networked point-of-sale systems that could feed a distributor's reporting automatically. There is no single data source to pull secondary sales from the way a large modern trade account might supply a sales-out report. The only place that number can be captured accurately is at the moment of the transaction itself, by the rep or sub-distributor making the delivery, on a route that might run through a barangay in Metro Manila one day and a rural stretch of Luzon, Visayas or Mindanao the next.
Tingi and frequent small restocks blur manual counts
Tingi buying behaviour, small, single-use quantities sold through sari-sari counters, means outlets restock in small amounts very frequently rather than placing large infrequent orders. A single sari-sari store might take a handful of sachets of one SKU on Monday and a different handful on Thursday. Multiplied across a route of forty or fifty stores, that pattern produces a high volume of small transactions that is genuinely difficult to track accurately on paper or through end-of-day manual entry, and easy to under-report or estimate loosely when a rep is rushing to finish a route before dark.
Layer the archipelago's geography on top of that. Field teams cover routes that combine road travel with inter-island freight, and typhoon season, with roughly twenty storms making landfall in an average year, routinely disrupts mobile signal and port access for days at a stretch. A manual or paper-based secondary sales process that depends on consistent daily connectivity to report back to head office will have gaps precisely on the routes and weeks where visibility matters most.
Reading the gap: using field-captured secondary sales data to spot channel stuffing
Once secondary sales are being captured reliably at the point of sale, the primary-to-secondary comparison becomes one of the most useful diagnostic tools a brand or distributor has. The logic is simple: if primary sales into a distributor consistently outpace that distributor's own secondary sales out to sari-sari and retail outlets over a sustained period, stock is accumulating somewhere in the chain rather than reaching the consumer. That accumulation is the definition of channel stuffing, whether it happens deliberately to hit a target or simply as an unintended consequence of an aggressive promotional calendar.
The signal is most useful when it is examined at a granular level rather than as a single national figure. A distributor-level view might show a healthy overall ratio while masking one route or one sub-distributor that is quietly building up unsold stock. Comparing primary intake against field-recorded secondary sales by distributor, and then by route within that distributor's territory, using data captured through sales force automation on every van sales and pre-selling visit, turns a vague suspicion of overstocking into a specific, actionable list: which accounts are over-ordering relative to what their own outlets are actually taking, and by how much.
Connecting secondary sales visibility to territory and route performance
Secondary sales data is far more useful when it is tied to the geography it was captured on, because two distributors, or two routes within the same distributor's territory, rarely behave the same way.
Route-level and beat-level secondary sales
Aggregating secondary sales only at the distributor or regional level hides exactly the variation that matters most. A route running through dense sari-sari clusters in a Metro Manila barangay will have a very different offtake pattern from a rural Mindanao beat covering a wider area with fewer, more spread-out outlets. Recording secondary sales at the individual outlet and route level, and rolling that data up through territory management structures, lets a distributor see which specific beats are underperforming against their coverage potential and which are consistently strong, rather than relying on a single blended territory average that flattens both signals into noise.
Spotting oversupplied routes versus genuinely underperforming ones
Not every route with weak secondary sales has a demand problem. Some have a coverage problem: outlets that are not being visited often enough, or reps skipping stops toward the end of a long beat. Others have a genuine oversupply problem, where earlier orders were sized against an optimistic target rather than actual outlet-level offtake. Distinguishing the two requires comparing secondary sales against visit frequency and route adherence data from route planning records, because a route with strong secondary sales per visit but low visit frequency needs more coverage, while a route with weak secondary sales despite full coverage needs a smaller, more realistic order going forward, not a change in the rep's schedule.
From secondary sales data to demand planning that matches real offtake
Once a distributor has a reliable, route-level secondary sales history, forecasting stops being a guess anchored to last month's primary order and starts being a projection built on what outlets actually took off the shelf. That shift matters most where SKU counts are high, which in a tingi-driven market is nearly everywhere: a single sari-sari store might carry several pack sizes of the same product line, each moving at a different pace. Reordering decisions built on aggregate category sales rather than SKU-level secondary sales tend to over-order the slow-moving sizes and under-order the fast-moving ones, which is a quiet but real source of both stockouts and dead stock sitting in the same warehouse at the same time.
Feeding SKU-level secondary sales into a SKU management process, alongside broader trend data pulled through distributor analytics, lets replenishment orders be sized against what a route is genuinely absorbing rather than what a purchasing calendar or a promotional target implies it should be absorbing. Over a few cycles, that discipline tends to reduce both ends of the imbalance: less capital tied up in slow-moving stock, and fewer emergency reorders on the SKUs that were quietly running out while the warehouse looked full on paper.
Building a reliable secondary sales data pipeline from van sales, pre-selling and field apps
None of this diagnostic or planning value exists without a dependable way to capture secondary sales at the point of transaction, which in most Philippine FMCG operations means the rep on a van sales or pre-selling route, working across a genuinely multilingual field force moving between Tagalog-speaking Luzon and Cebuano-speaking Visayas and Mindanao. Consistent, structured capture across that many reps and regions does not happen by asking everyone to fill in a paper log the same way; it needs a mobile app built for the conditions those reps actually work in.
That means offline-first capture that keeps recording sales, stock and payment data even when a route runs into a rural signal gap or a typhoon knocks out coverage for a few days, syncing automatically once connectivity returns rather than losing the data or forcing a rep to reconstruct it from memory later. It also means the same app is doing double duty: logging the secondary sale itself through field activity management, while retail execution and merchandising audits capture shelf presence and stock-on-hand at the same visit, so a distributor can cross-check what was sold against what is actually sitting on the shelf, rather than trusting either number in isolation.
How 1Channel gives Philippine distributors real secondary sales visibility
1Channel's field platform captures secondary sales at the point of the van sales or pre-selling transaction, outlet by outlet and route by route, and syncs that data against primary purchase records automatically, so the primary-to-secondary comparison described above is available continuously rather than reconstructed at quarter-end from disconnected spreadsheets. Every sale a rep logs is tagged to a specific outlet, route and territory, which means the channel stuffing signal, the route performance view and the SKU-level demand picture are all reading from the same underlying data rather than three separate systems that never quite agree.
Because the mobile app is built offline-first, secondary sales keep getting captured on routes running through rural signal gaps or affected by typhoon disruption, and the data syncs the moment connectivity returns rather than arriving days late or not at all. For a distributor operating across Luzon, Visayas and Mindanao with a genuinely multilingual field team, that consistency is what turns secondary sales visibility from an occasional audit exercise into a number the business can plan against every week.
See Real Demand, Not Just Restocking
Compare primary and secondary sales side by side, right down to the route and the outlet, and catch channel stuffing before it becomes a warehouse full of ageing stock.
Explore Sales Analytics →Key Takeaways
Primary sales confirm that a distributor ordered from the brand; secondary sales confirm that consumers actually bought. Getting both numbers, and the gap between them, into view is what protects a distributor and a brand from mistaking restocking discipline for real demand.
- Primary and secondary sales measure different things. Primary sales record brand-to-distributor shipments; secondary sales record what actually moves from distributor or sub-distributor to sari-sari stores and other retail outlets.
- A healthy primary number can hide a stalling channel. Distributors chasing targets or promotional buy-ins keep ordering even when earlier stock has not cleared, and that gap is invisible until warehouses and credit lines are already stretched.
- Sari-sari scale makes secondary sales genuinely hard to see. With around 1.1 million small, independently run outlets and no unified point-of-sale feed, secondary sales can only be captured reliably at the point of the transaction itself.
- Tingi buying and archipelago connectivity compound the challenge. Frequent small restocks are easy to under-report manually, and rural signal gaps or typhoon disruption break paper-based or connectivity-dependent reporting exactly when visibility matters most.
- Comparing the two numbers by route exposes channel stuffing early. A distributor-level average can mask one overstocked route; route-level comparison turns a vague suspicion into a specific, actionable list.
- Route-level secondary sales data sharpens demand planning. SKU-level offtake by route replaces guesswork with replenishment sized against what outlets are genuinely taking, reducing both stockouts and dead stock at once.