Maximizing brand presence at the point of sale requires complete transparency into field execution.
The advanced retail coverage dashboard is an administrative hub designed to track, monitor, and evaluate retail store coverage, visual merchandising deployment, and field force compliance.
By centralizing metrics related to field audits, journey planning, and asset tracking, the admin portal gives leadership teams real-time visibility into the exact status of retail execution.
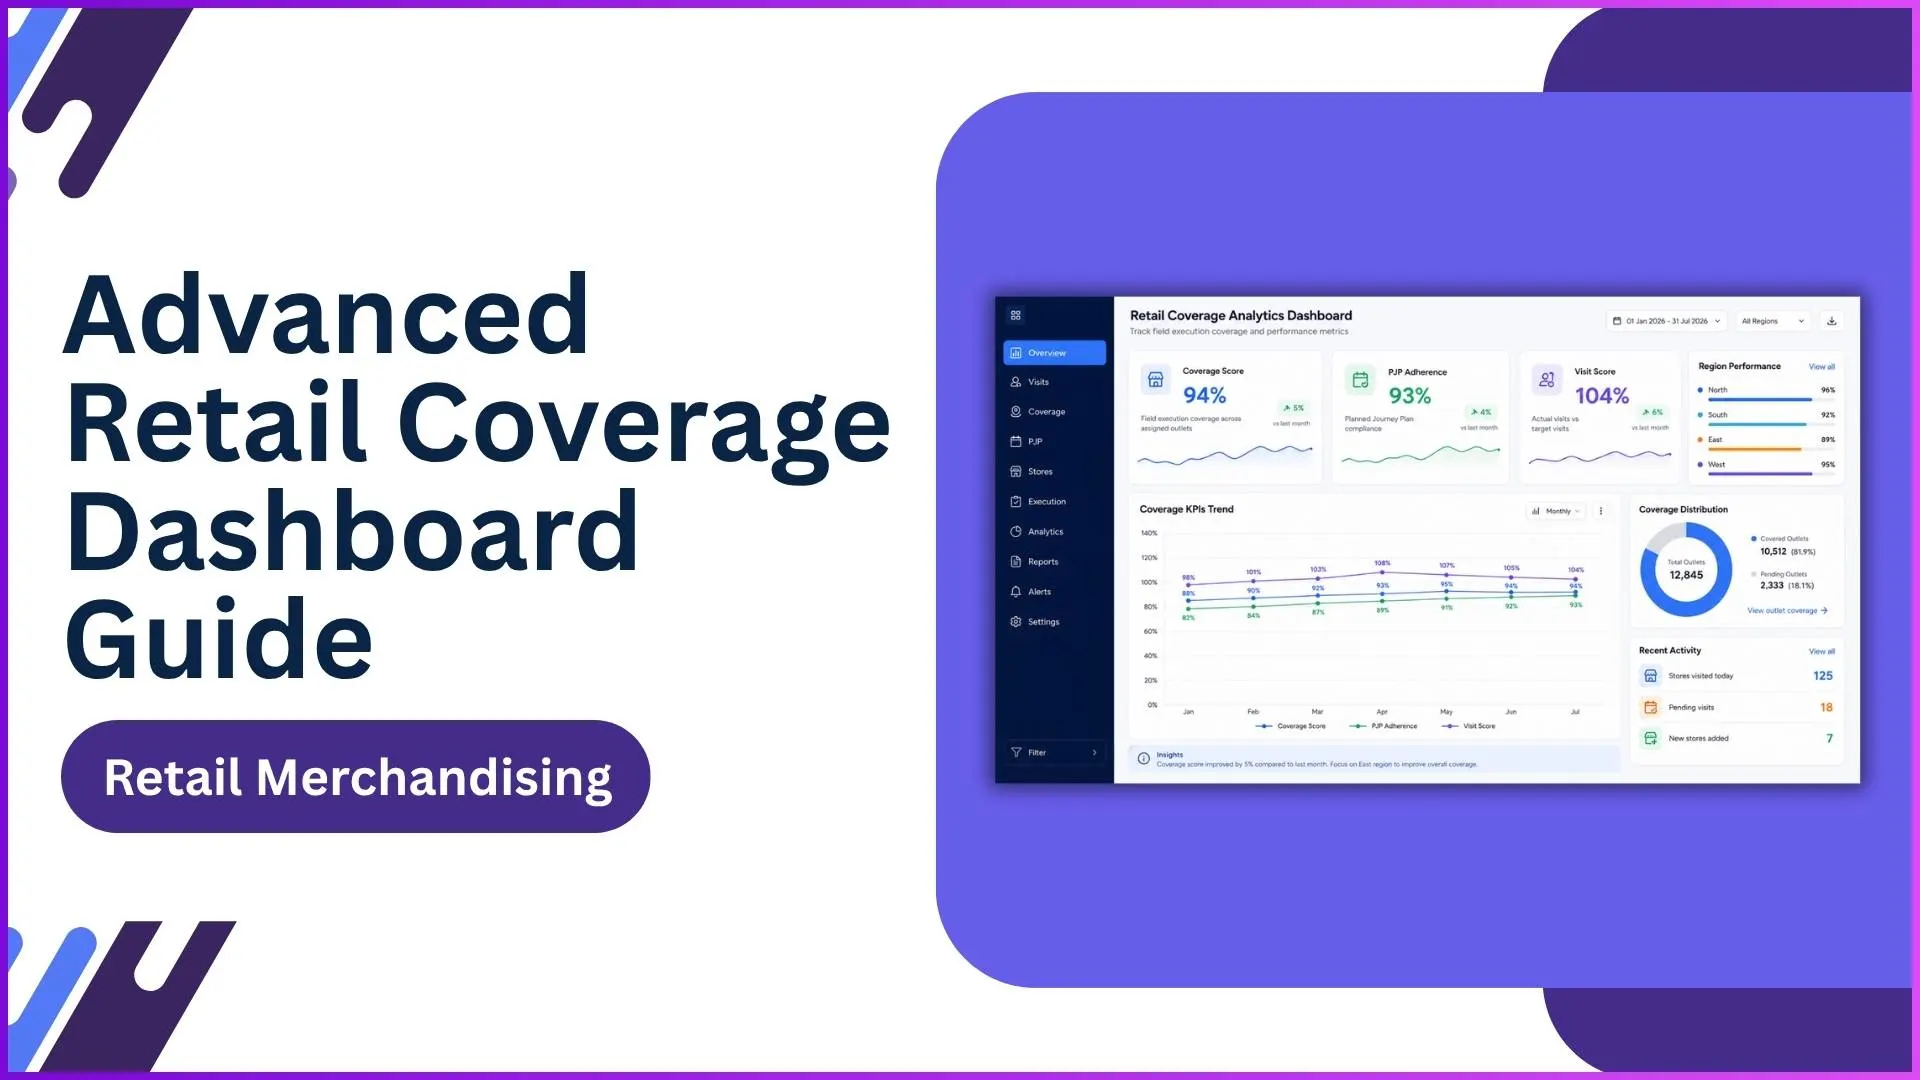
1. Structuring the Execution Workspace
The dashboard operates hierarchically, moving from top-level macro overviews to store-specific audit parameters. The foundational structure maps data directly from field activities through predefined pathways:
Advanced Dashboard > Coverage Dashboard
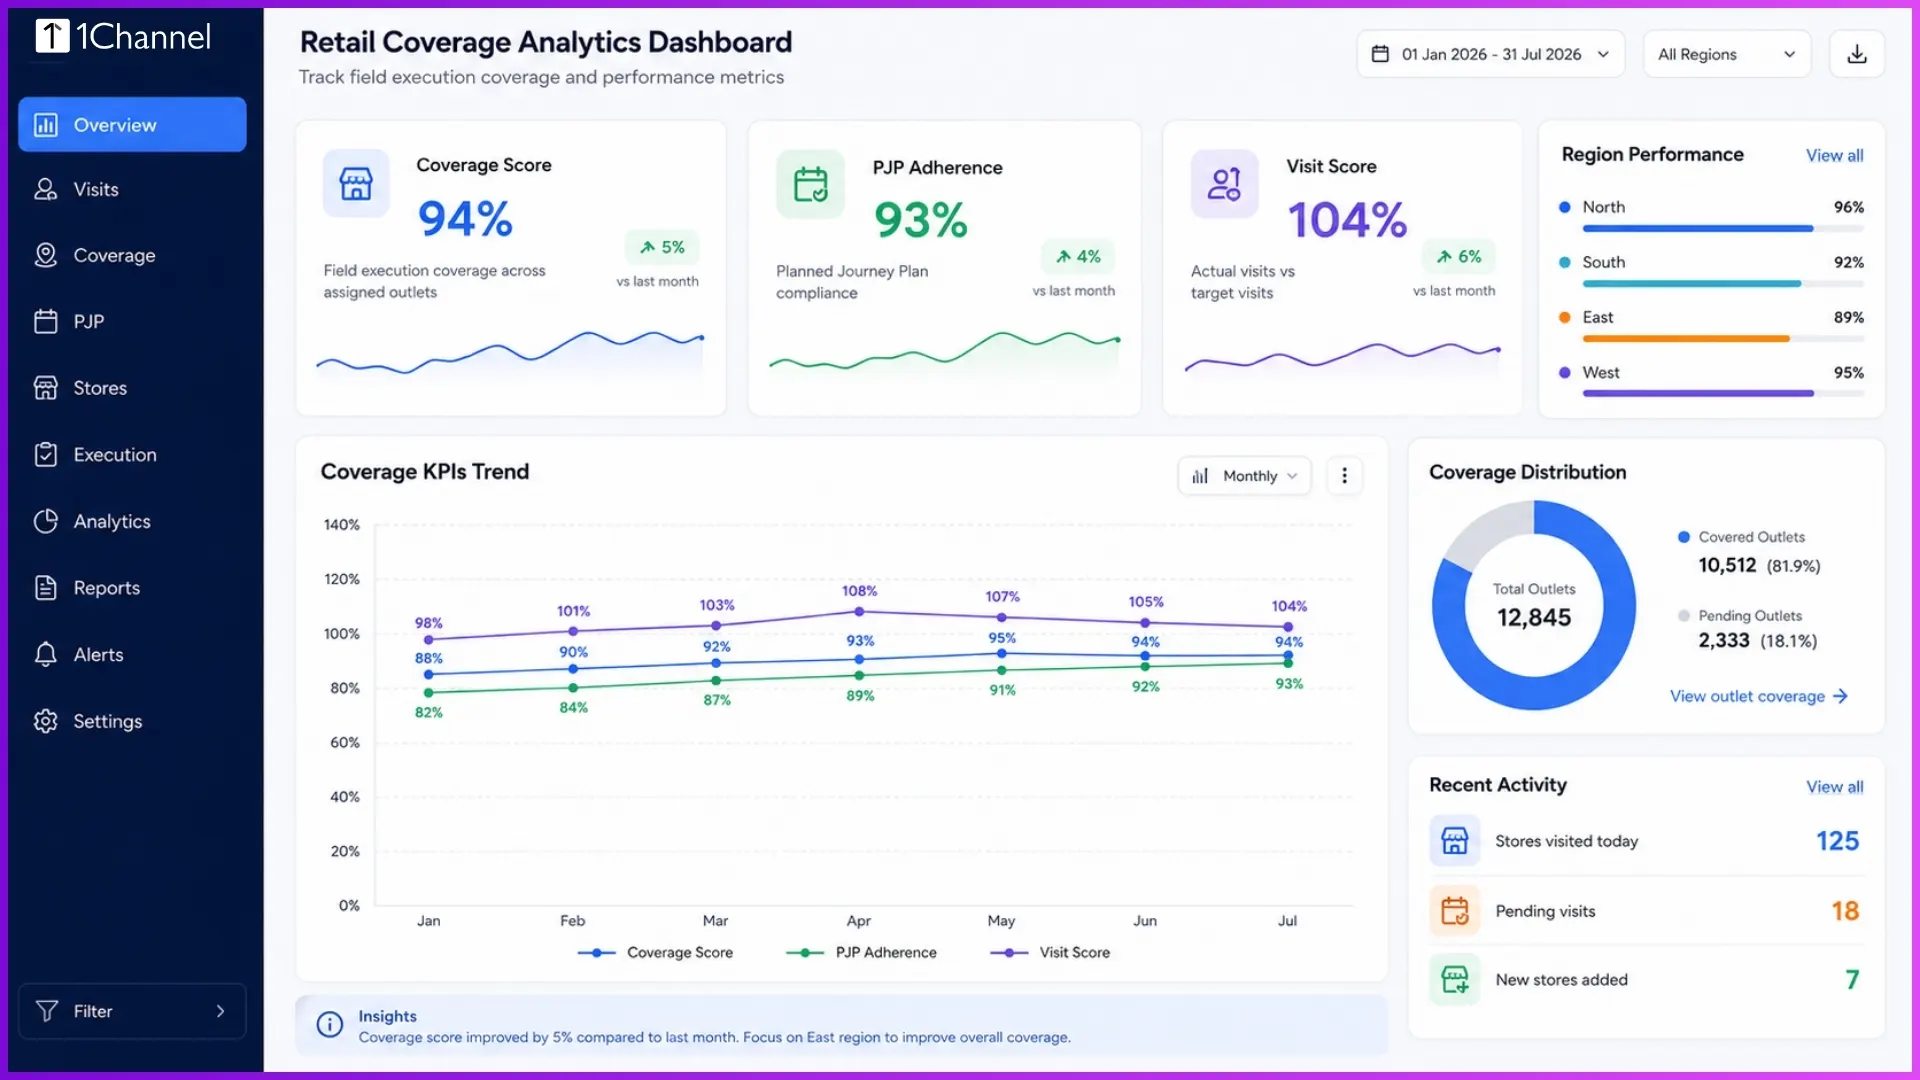
Monitors immediate compliance indicators including overall Coverage Scores, Permanent Journey Plan (PJP) Adherence, and Visit Scores.
Advanced Dashboard > VM Coverage Dashboard
Breaks down performance into precise Target vs. Achievement tables, tracking stores covered against initial operational goals.
Advanced Dashboard > Appealing Visibility Dashboard
Analyzes core facing indexes, universe metrics, and localized visual compliance parameters across territories.
2. Key Operational Indicators on the Dashboard
The system tracks field execution using automated productivity reports and real-time summaries:
Field Force Efficiency & Time Management
The portal tracks the time spent inside retail outlets to calculate operational efficiency. Admin screens show critical metrics like Average Audits Per Day, Average Audit Time, and Average Active Time.
For instance, a high-performing field auditor might complete 201 audits with an average time of 00:01:33 per store, optimizing territory coverage.
Auditor and Supervisor TAT Tracking
The dashboard calculates a Supervisor Turnaround Time (TAT) Efficiency Score to ensure high quality.
This tracks the total number of audits completed within the allowed timeline (typically 4–5 days) to ensure quick operational reviews.
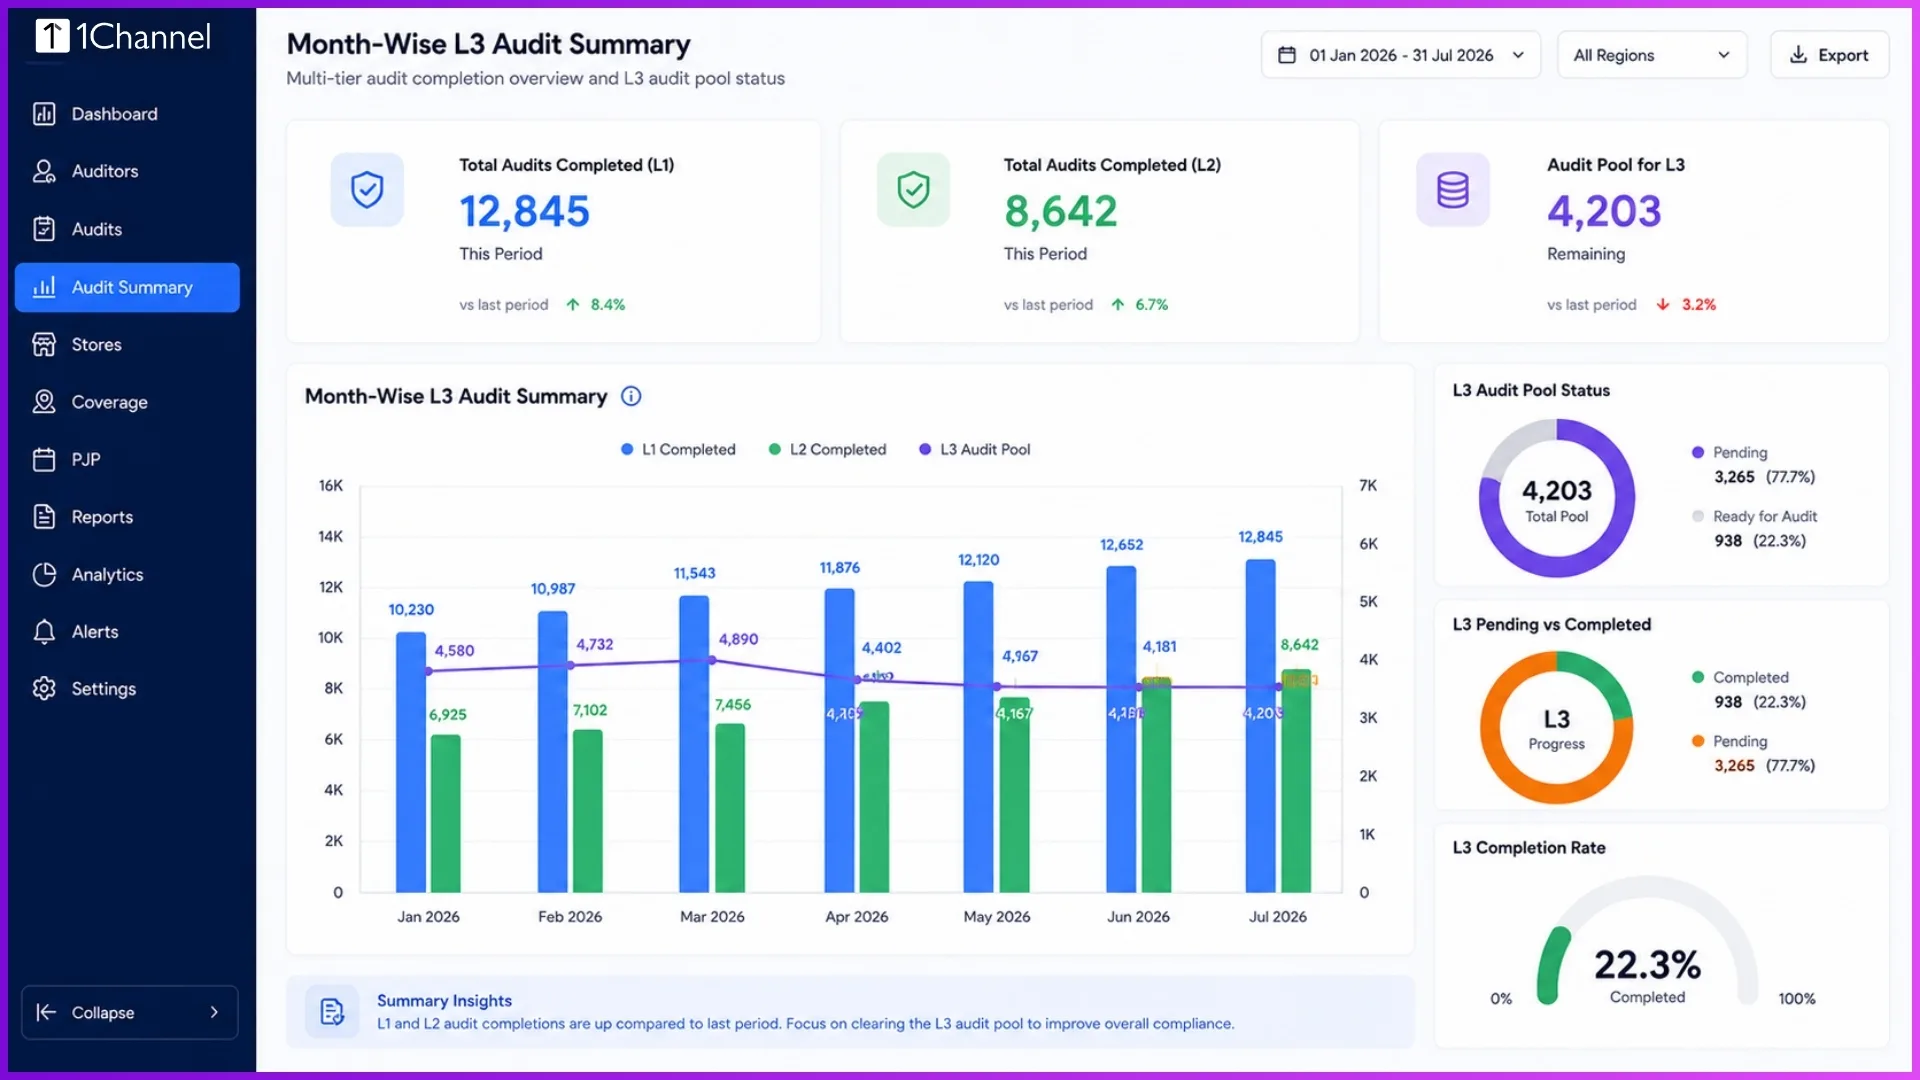
Multi-Level Audit Pool Architecture
To maintain maximum data accuracy, field data flows through a structured multi-level audit validation process:
- Level 1 (L1): Initial data collection and photo submission by the Field Force Executive.
- Level 2 (L2): Primary review layer evaluating product facings and placement criteria.
- Level 3 (L3): Multi-level verification by supervisors to resolve scoring conflicts and confirm final accuracy.
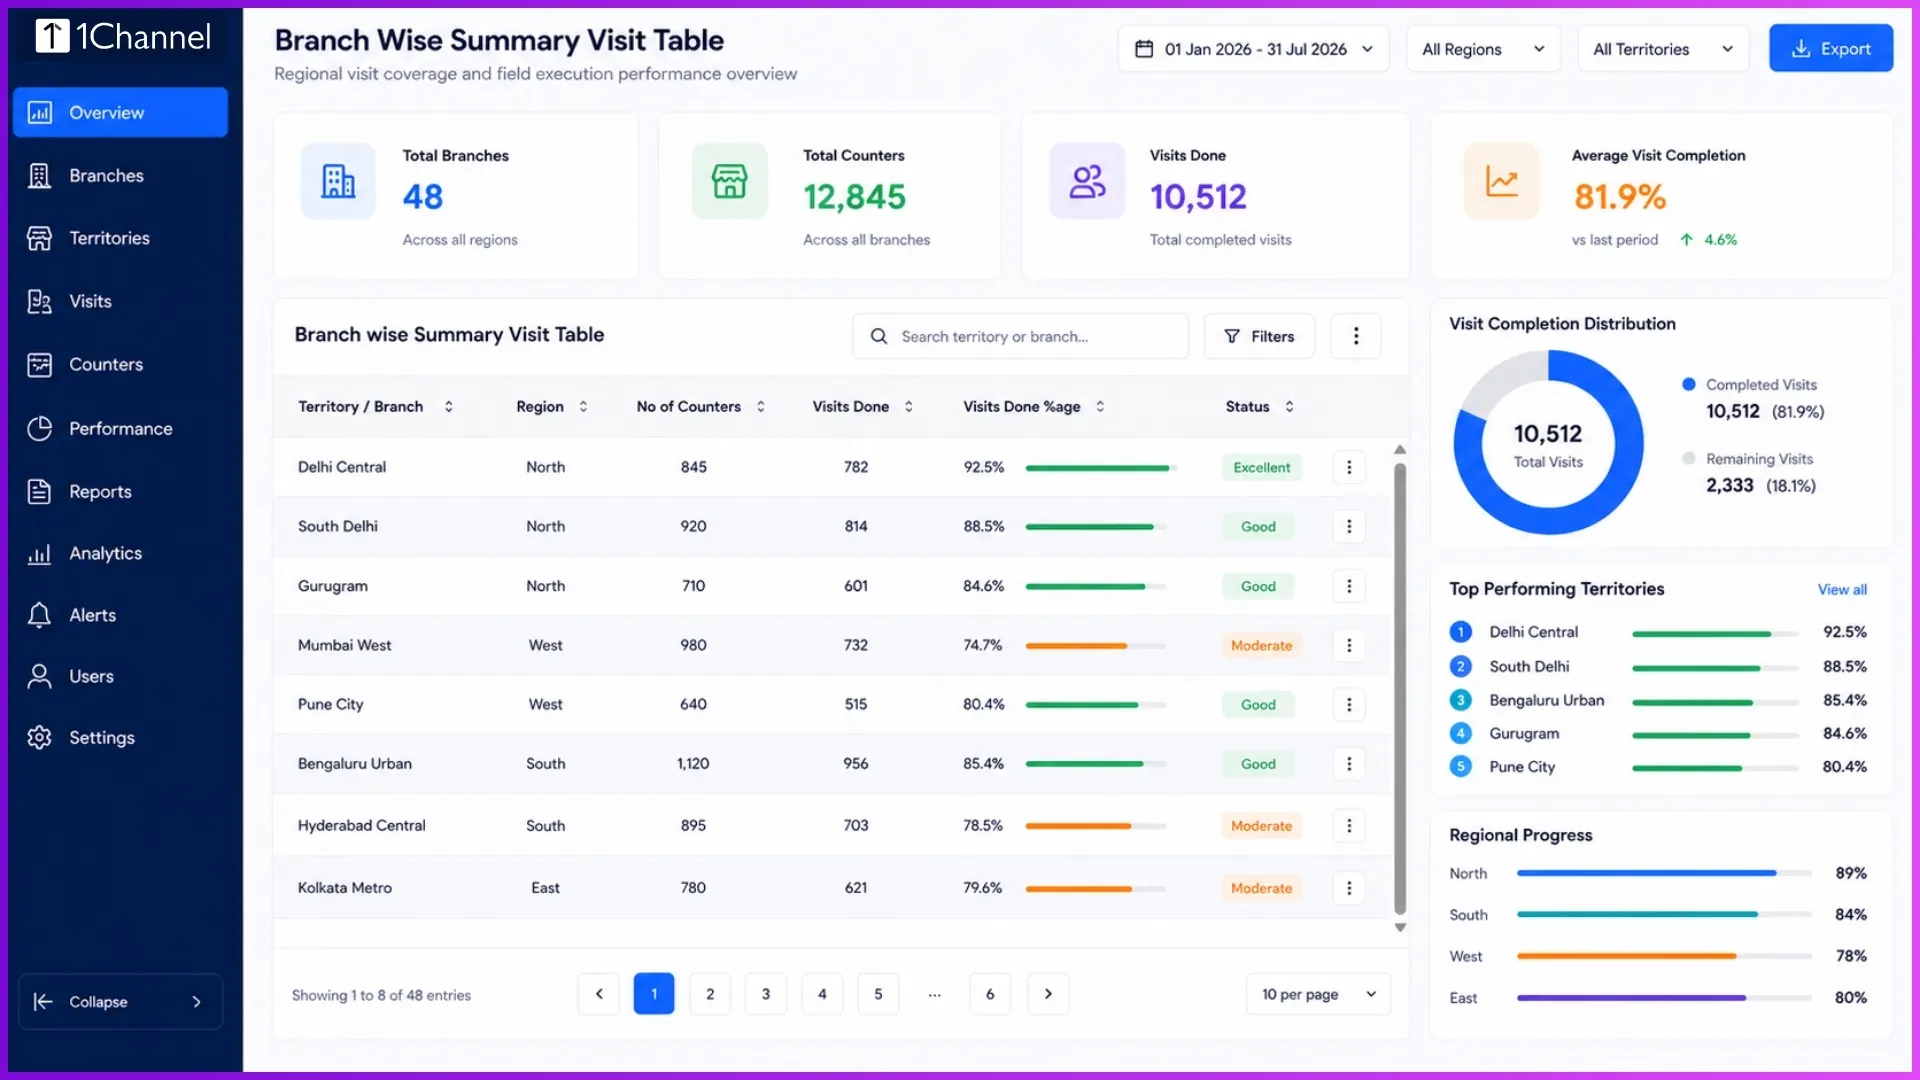
Data-Driven Territory Overviews
The portal provides a comprehensive Branch Wise Summary Visit Table that tracks the total number of counters, actual visits completed, and overall target percentages across major operating hubs like Ahmedabad, Bengaluru, Bhopal, and Chennai.
- Admin Coverage KPIs Overview
- Field Force Productivity Table
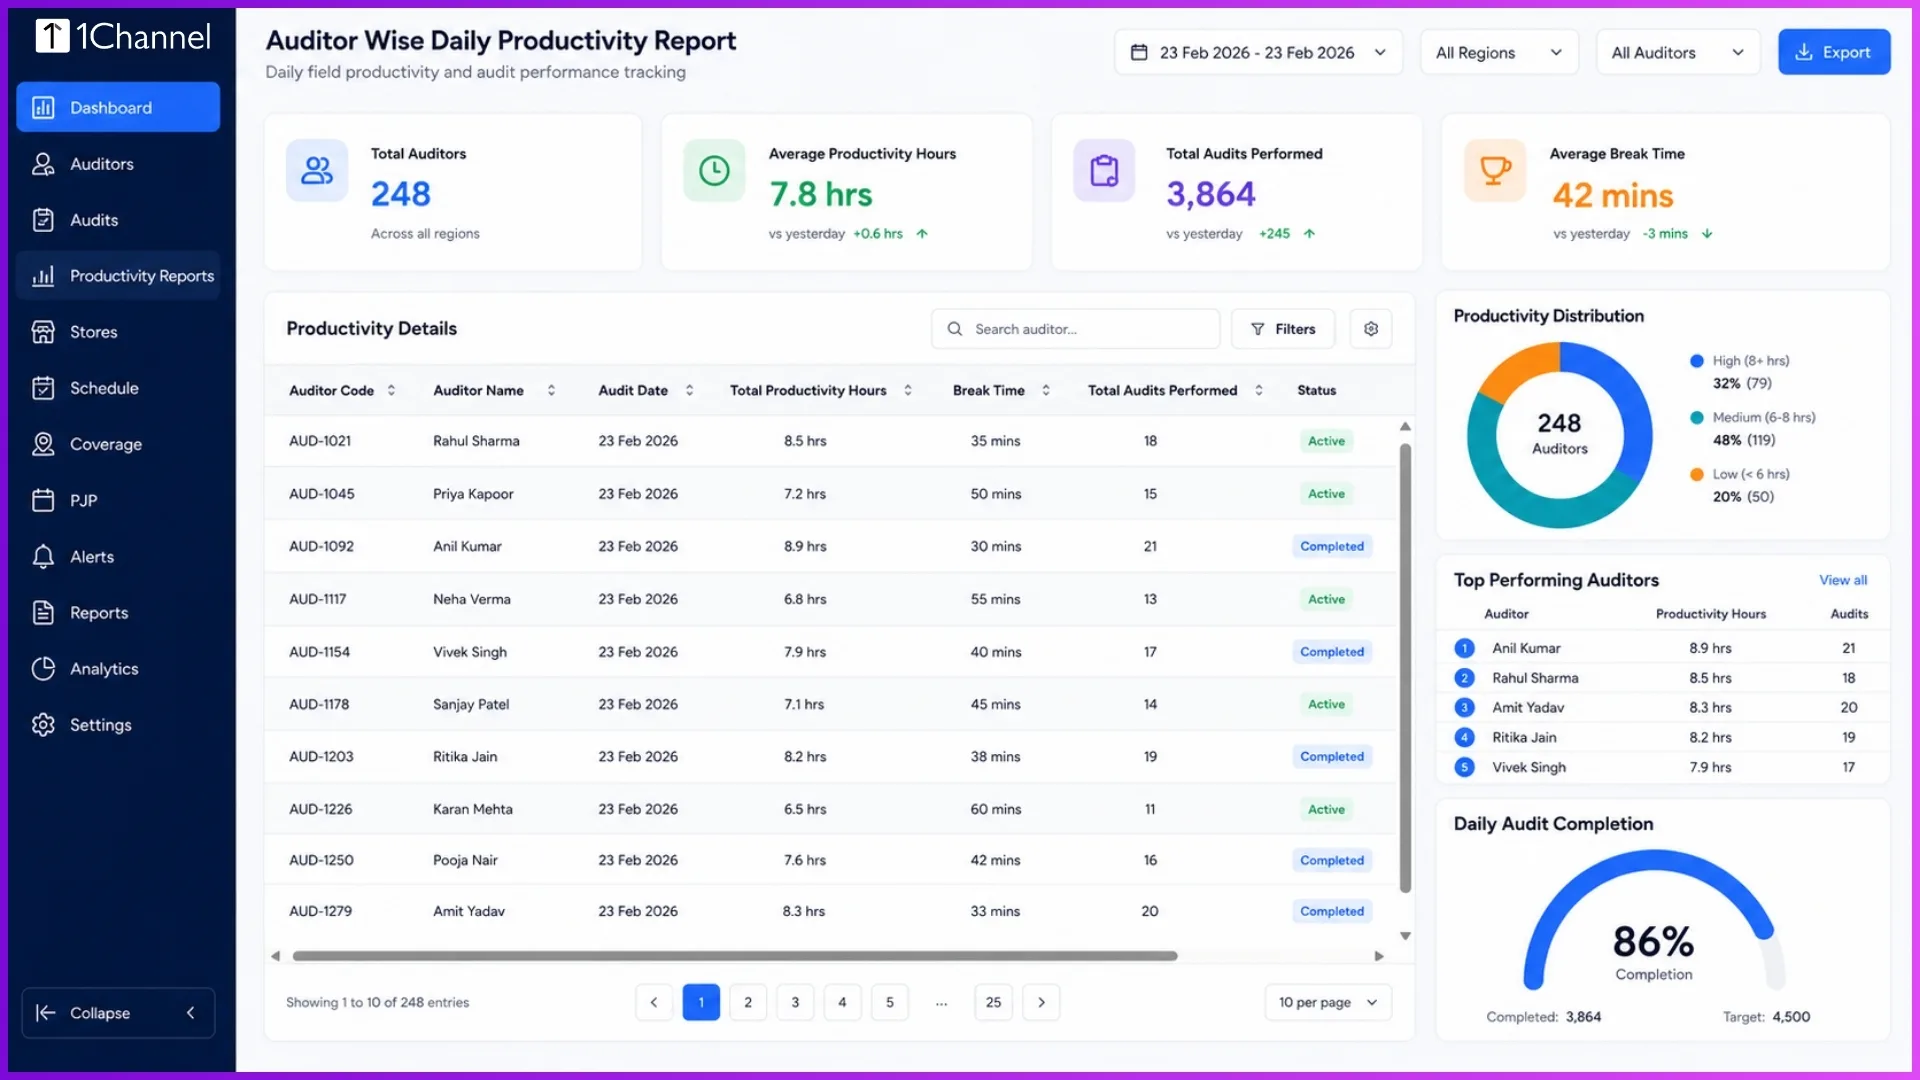
- Multi-Tier L3 Audit Summary Chart
3. Custom Performance Parameters
Beyond standard checks, the system tracks specific metrics to capture the exact layout of a store's display:
- Facing Norms Compliance: Automatically checks if the current shelf displays match or exceed the minimum target baseline (Facing≥Norm).
- Hot Zone Placement: Confirms that products are positioned within the primary visual range, which is typically between 3 to 6 feet.
- Togetherness Score: A binary metric (Yes/No) that evaluates if a brand family is arranged logically from premium to standard variants.
Driving Excellence with 1Channel
To effectively run these advanced features, retail brands need robust platform integration. 1Channel provides an end-to-end framework that simplifies complex merchandising operations.
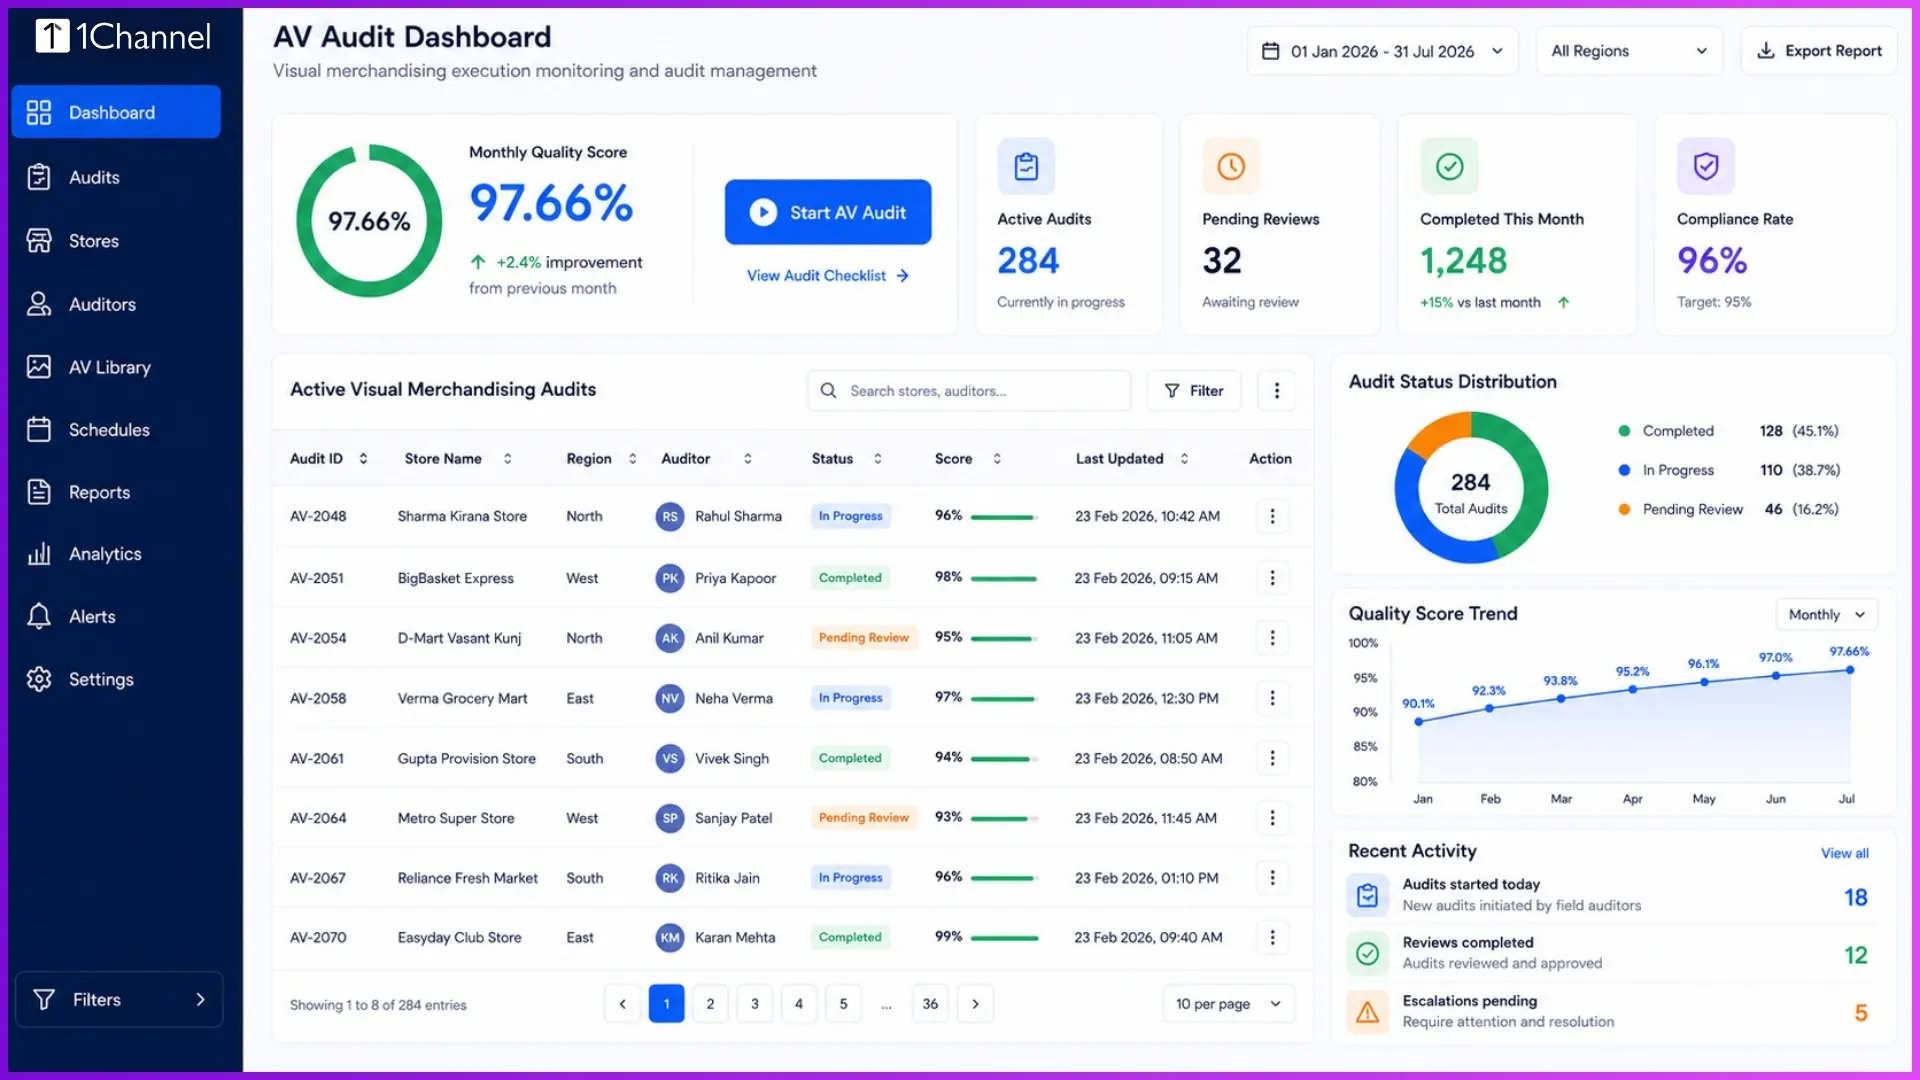
By organizing paths like 1Channel > Advanced Dashboard and 1Channel > Visual Merchandising > AV Audit Dashboard, the platform ensures field executives can quickly upload clear display data. This helps supervisors easily catch visibility gaps and optimize execution.
- Visual Merchandising Audit Interface
- Regional Coverage Performance Breakdown
Explore 1Channel Retail Merchandising Software
See how 1Channel's Retail Merchandising Software powers the Advanced Coverage Dashboard, multi-level audit pools, and custom shelf compliance parameters across every retail outlet.
Explore Retail Merchandising Software →Conclusion
The Advanced Retail Coverage Dashboard transforms raw field data into clear, actionable retail insights.
By monitoring real-time PJP compliance, managing multi-tier audit systems, and tracking shelf parameters, companies can eliminate execution gaps and ensure their products are always perfectly presented on store shelves
Frequently Asked Questions
Q: What is the primary purpose of the Advanced Retail Coverage Dashboard?
It serves as an administrative hub to track, monitor, and evaluate retail store coverage, visual merchandising deployment, and field force compliance.
Q: How is field force efficiency calculated on the portal?
The dashboard tracks time spent inside retail outlets to monitor metrics like Average Audits Per Day, Average Audit Time, and Average Active Time.
Q: What does the Supervisor TAT Efficiency Score measure?
It tracks the total number of audits completed within the allowed timeline to ensure quick operational reviews and data quality.
Q: What are the three levels in the multi-level audit pool?
Data flows from initial field execution collection (L1), through primary evaluation (L2), to final supervisor verification (L3).
Q: How does the dashboard evaluate shelf display compliance?
It uses custom performance parameters like Facing Norms Compliance, Hot Zone Placement, and the brand family Togetherness Score.
Note: Software screens may vary based on your business structure and configured workflows.