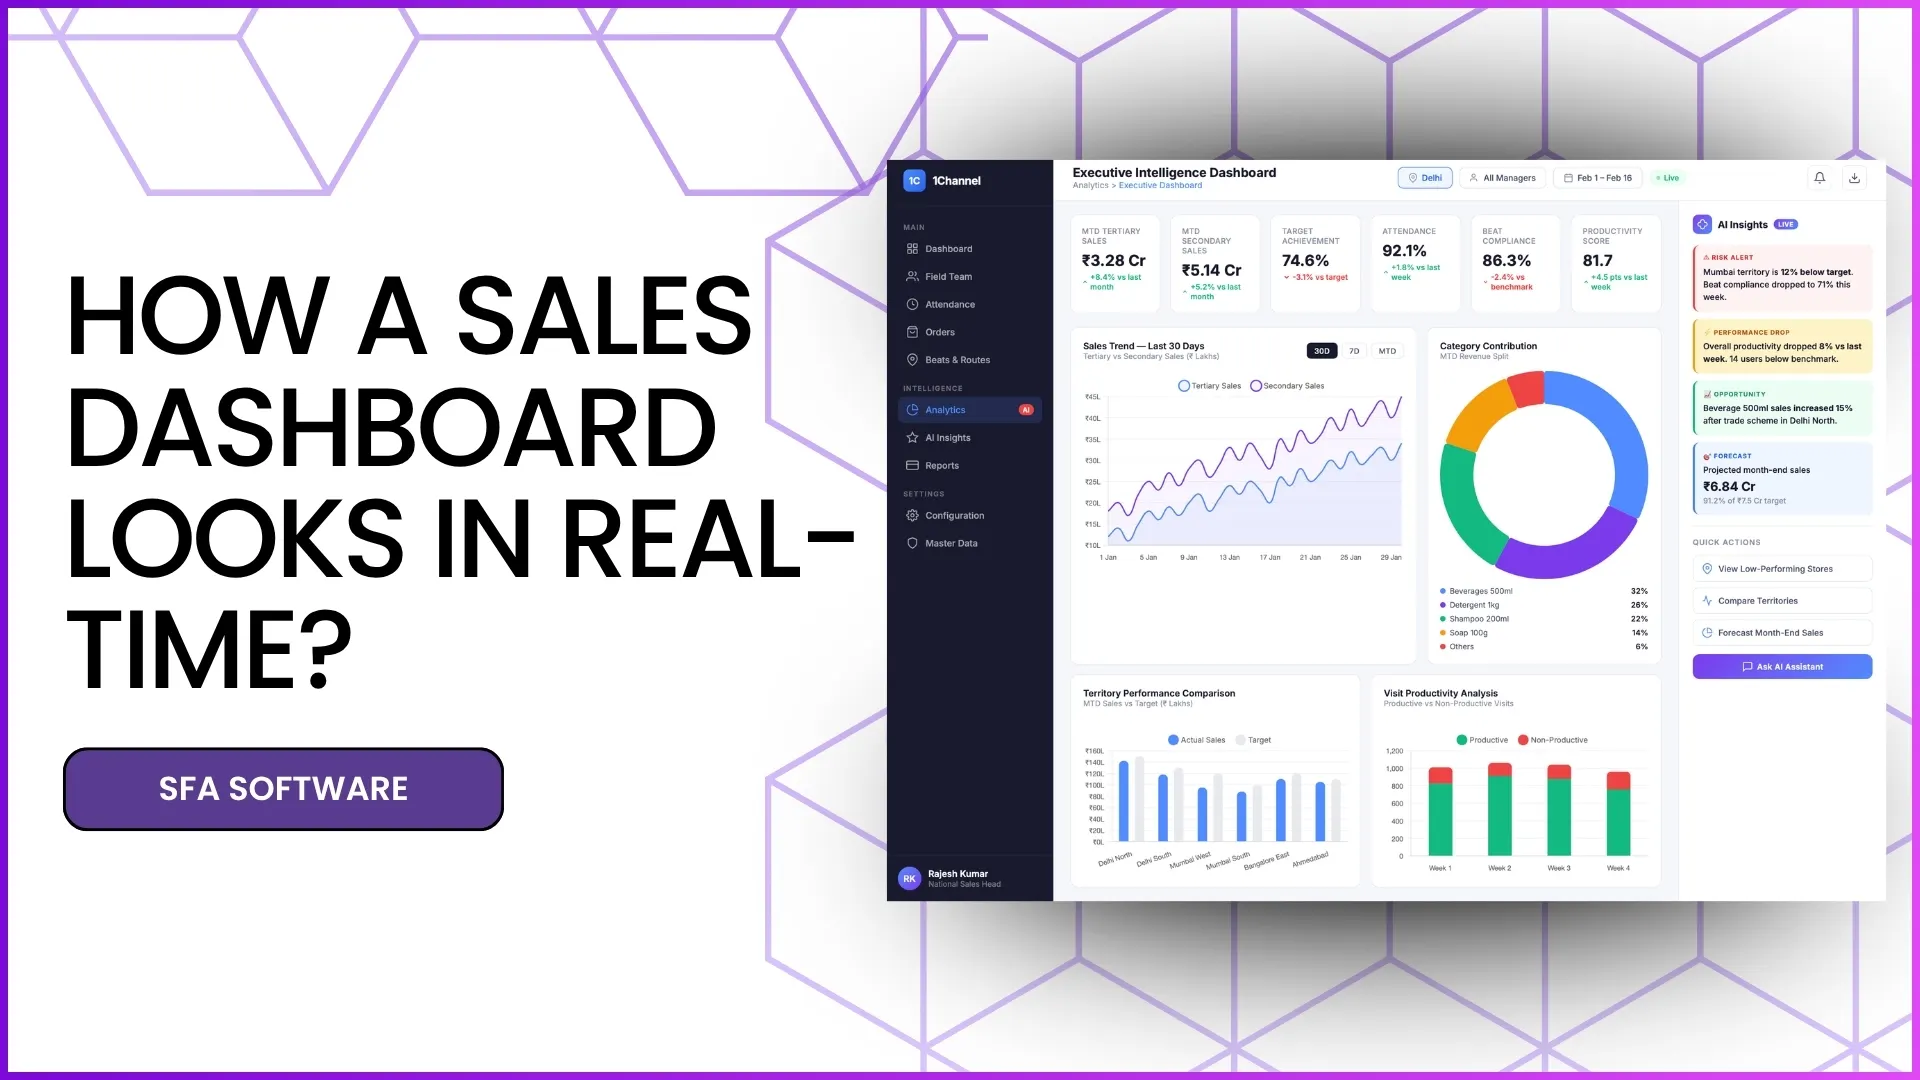
In field sales operations, planning visits is only half the job, execution is what truly drives results. This is where a Beat Compliance Dashboard becomes essential.
A beat compliance dashboard helps managers and sales leaders track whether field representatives are following their assigned journey plans, visiting the right outlets, maintaining frequency standards, and recovering missed visits on time.
From route adherence and live maps to visit recovery trends, this dashboard gives a complete picture of how efficiently the field team is operating.
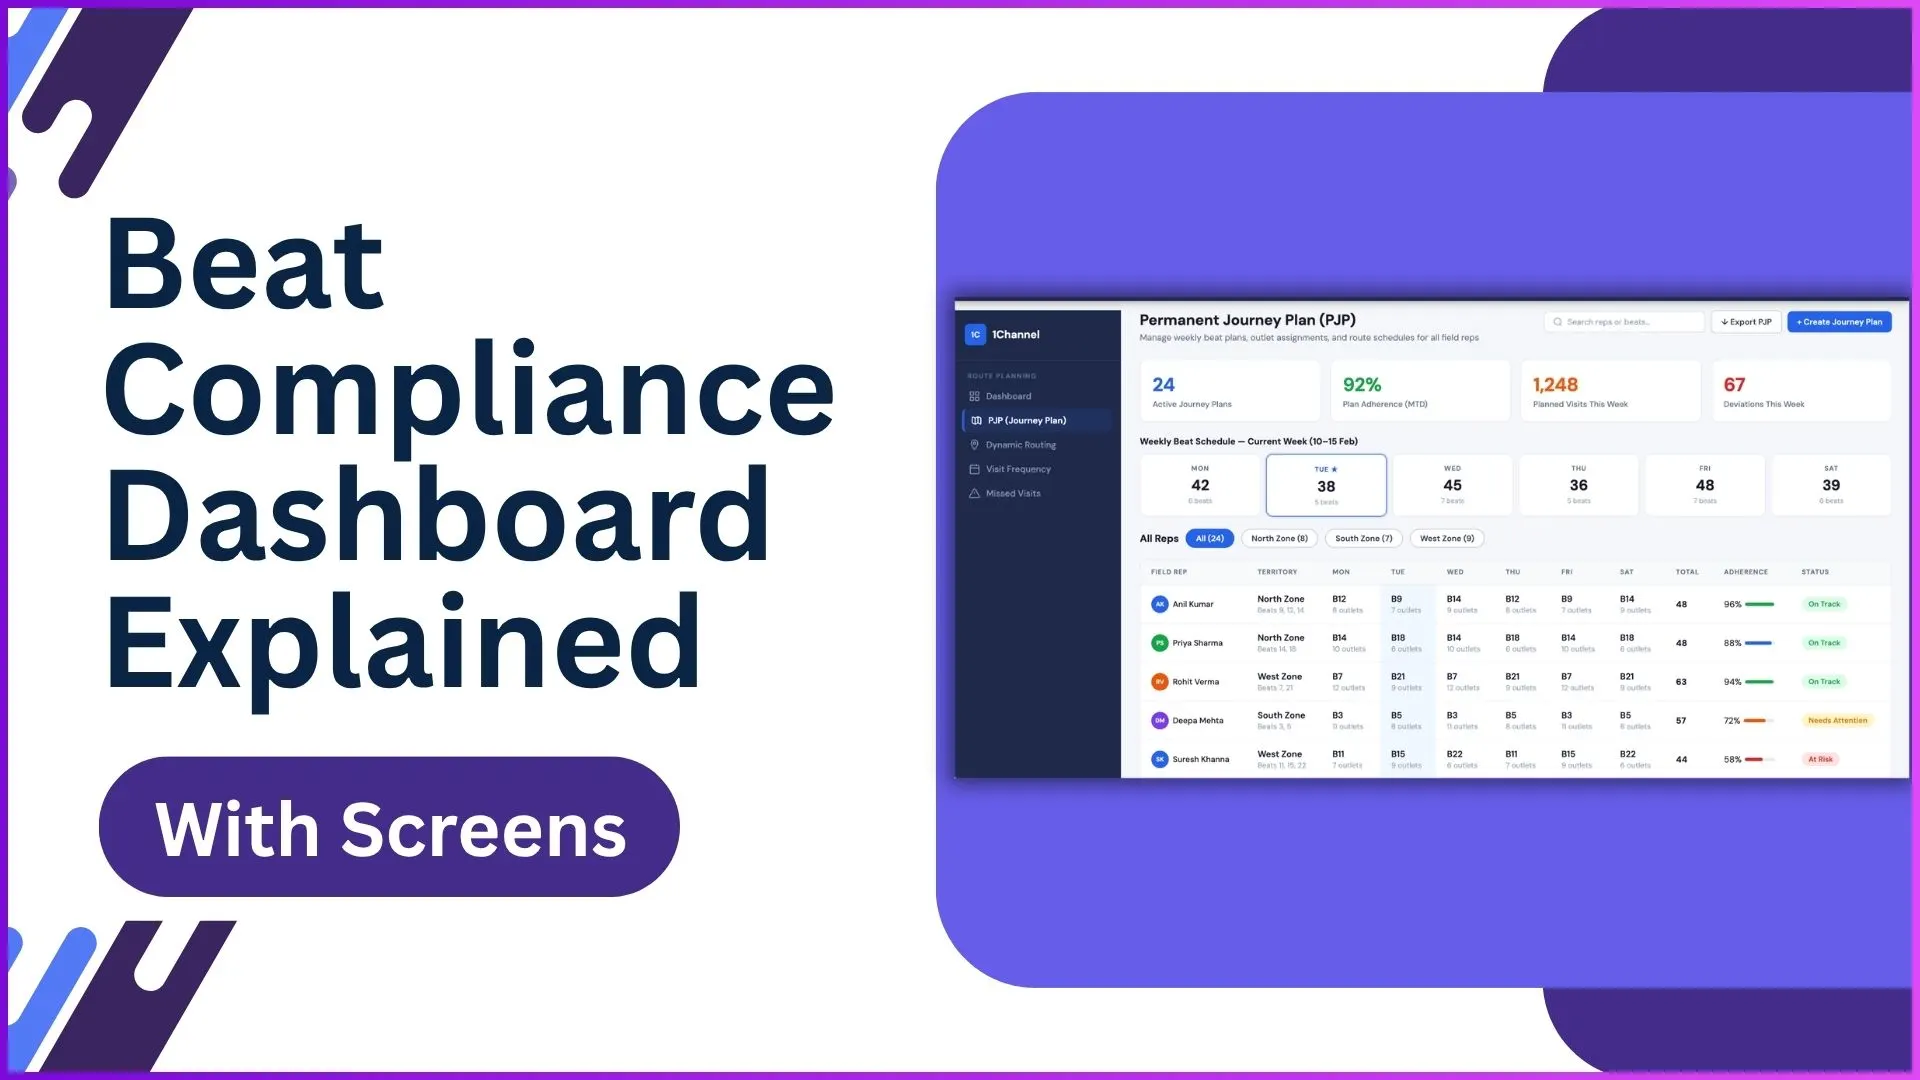
In this blog, we explain the Beat Compliance Dashboard with screen-wise breakdowns, so you can understand how each module contributes to better field visibility and execution.
What is a Beat Compliance Dashboard?
A Beat Compliance Dashboard is a centralized analytics screen that tracks how closely field teams follow their approved beat plans.
It combines planned visits, actual outlet coverage, route movement, and visit frequency into one operational view.
As defined in the provided SFA document, beat compliance is measured as:
Number of stores covered in a day ÷ Number of stores assigned in the beat plan for that day
This makes it easy for managers to instantly identify:
- missed outlets
- route deviations
- under-performing field reps
- frequency gaps
- travel inefficiencies
Explore Route Planning Software
Optimize beat planning, route adherence, and field execution with advanced route planning capabilities and live compliance tracking.
Learn More About Route Planning →1: Journey Plan KPIs Dashboard
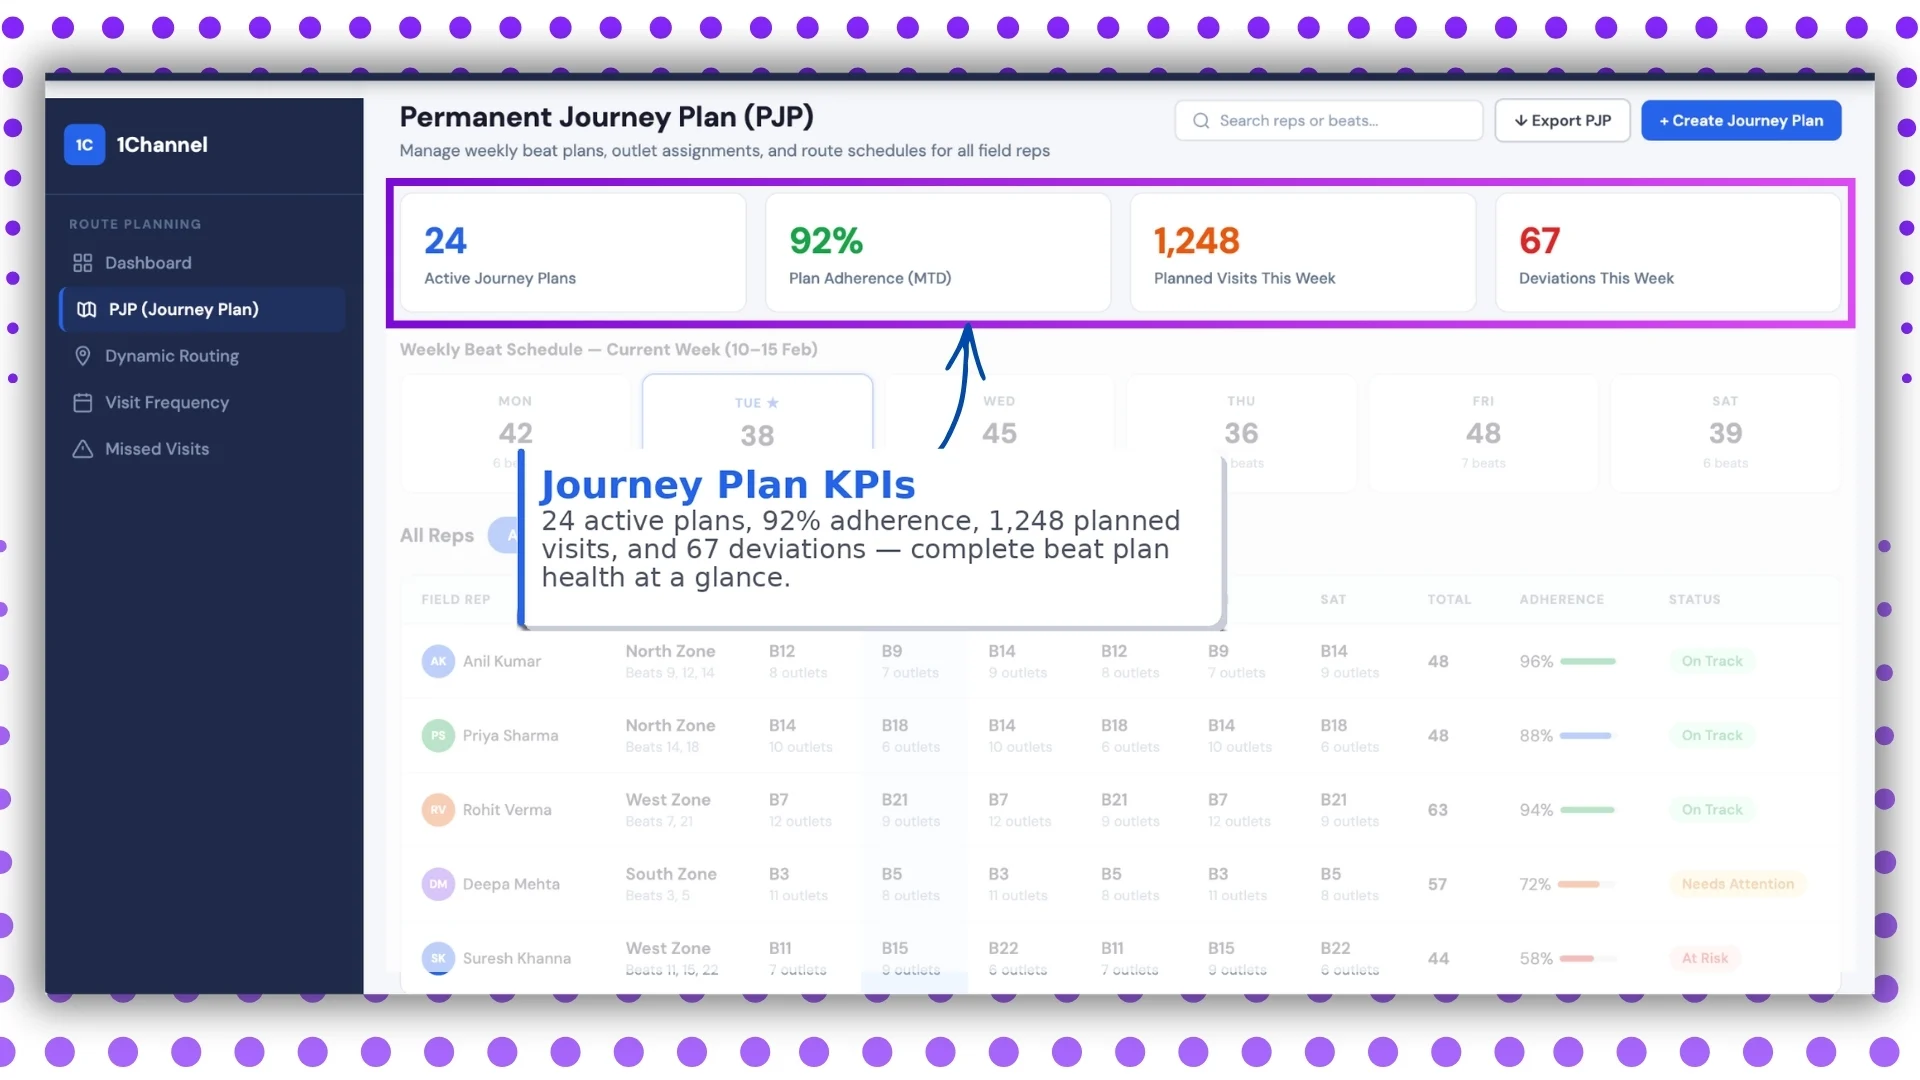
The first screen gives an instant snapshot of overall beat health.
Key KPIs Visible
- 24 active plans
- 92% adherence
- 1,248 planned visits
- 67 deviations
This screen is ideal for leadership-level monitoring because it instantly answers:
- How many beat plans are active?
- Are teams following the assigned routes?
- How many visits deviated from the plan?
This directly aligns with the Beat Plan Approval and Market Visit Plan modules mentioned in the document.
2: Weekly Beat Schedule
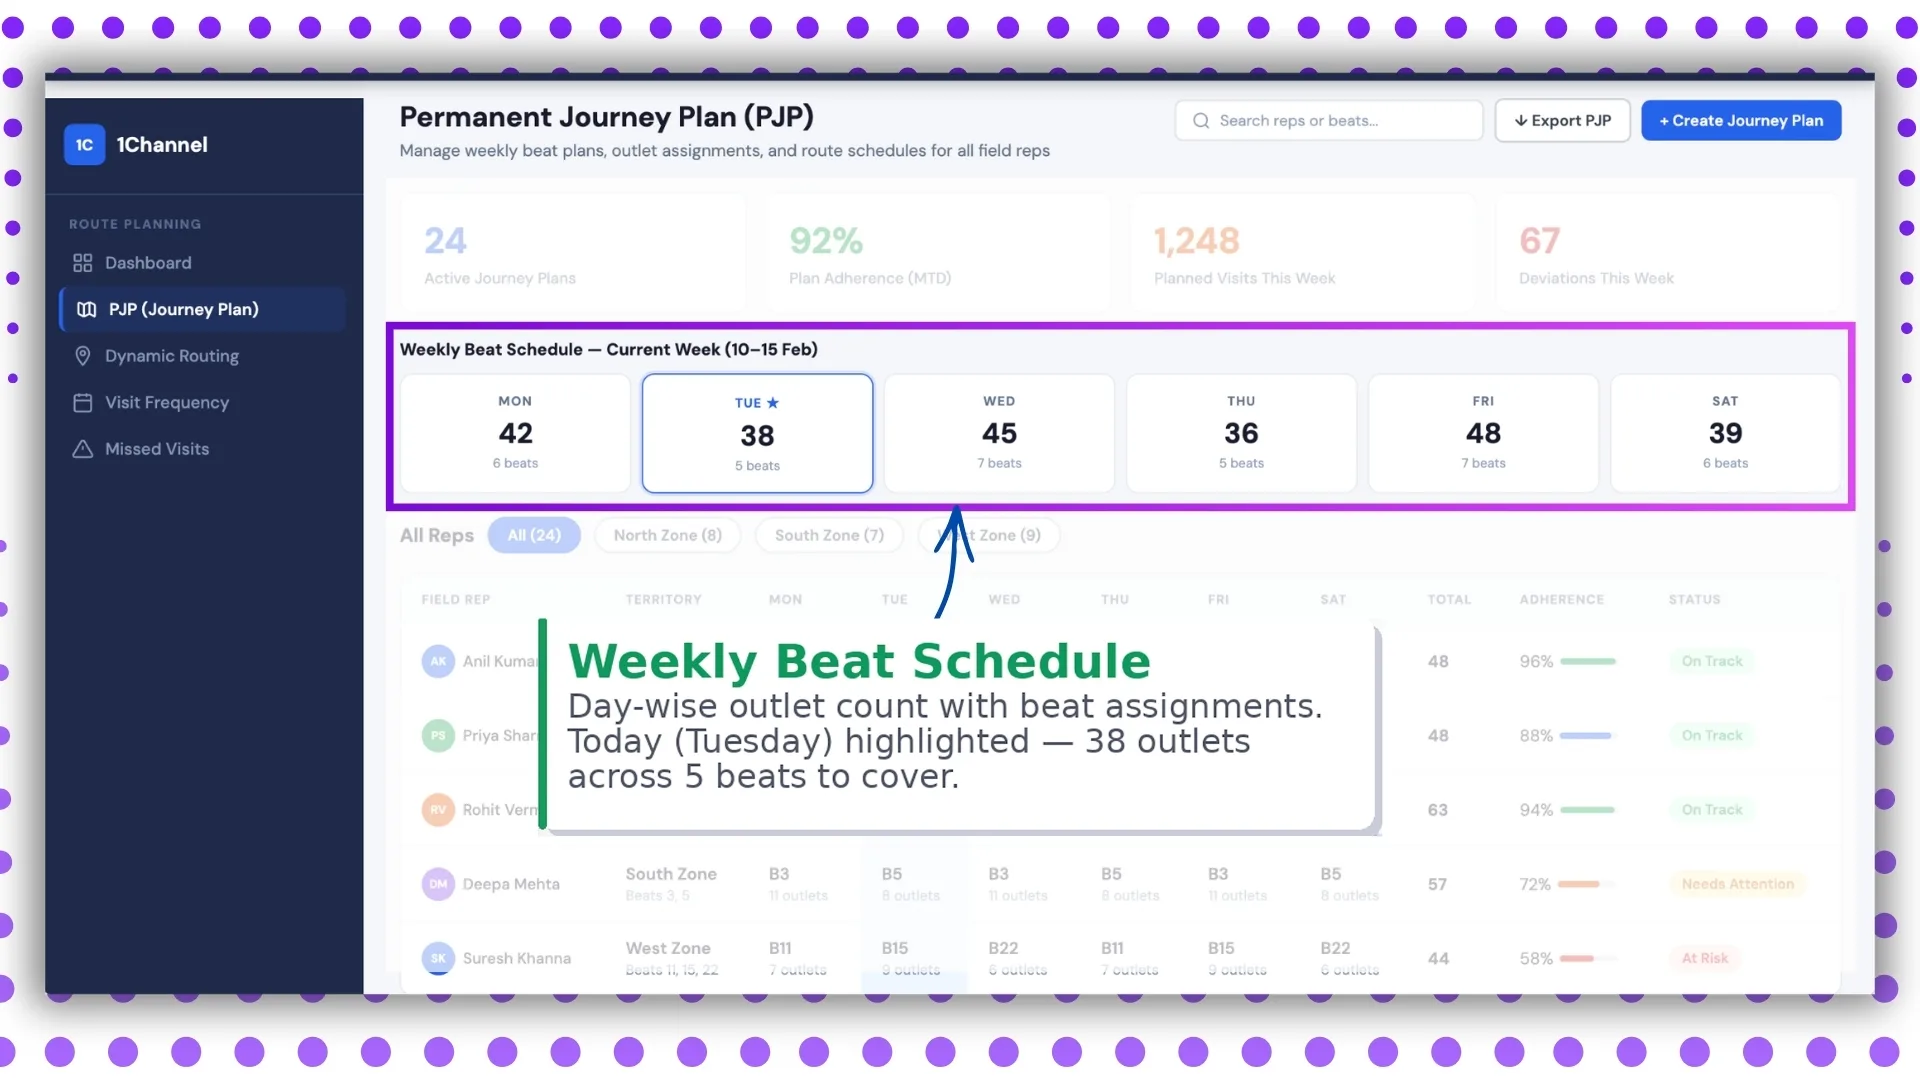
This screen provides a day-wise view of outlet assignments.
For example:
Tuesday: 38 outlets across 5 beats
This helps managers understand workload distribution and daily outlet coverage expectations.
The uploaded document clearly mentions Weekday Market Visit Plan, where visits are scheduled according to weekdays such as Monday, Tuesday, Wednesday, and so on.
This screen visually converts that plan into an easy-to-track operational dashboard.
3: Field Rep Adherence Tracker
This is one of the most critical screens for team monitoring.
It shows rep-wise data such as:
- daily beat assignments
- total planned visits
- completed visits
- adherence %
- visual progress bar
- status labels
Status Indicators
- On Track
- Needs Attention
- At Risk
This helps managers identify which representatives need intervention before compliance drops further.
4: AI Route Optimization Dashboard
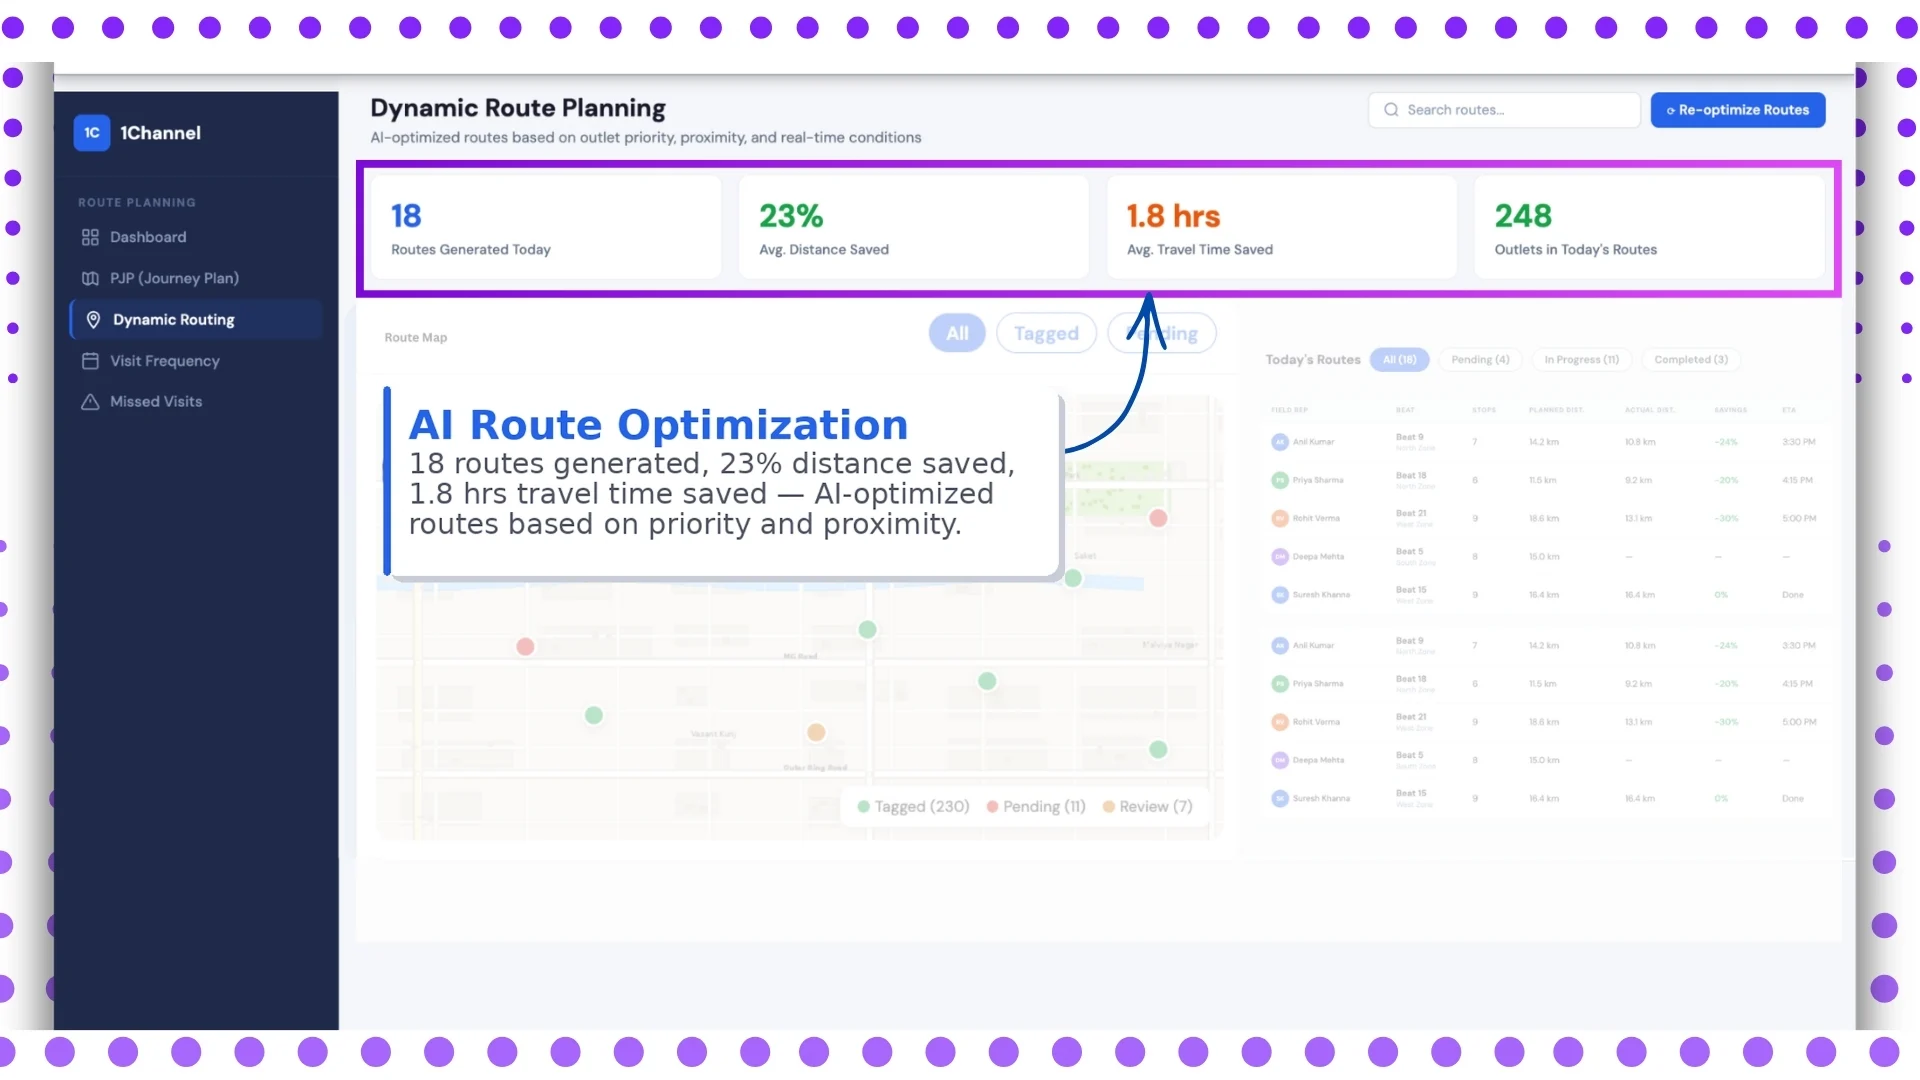
Travel time directly impacts productivity.
This screen focuses on route efficiency.
Key Metrics
- 18 routes generated
- 23% distance saved
- 1.8 hours travel time saved
The provided content also references distance and movement tracking through:
- User Activity Report
- Distance Between Stores Report
This screen builds on that operational intelligence by showing how route optimization improves field efficiency.
5: Live Route Map
This is the visual route monitoring screen.
It includes:
- 230 tagged outlets
- 11 pending visits
- 7 review items
- live GPS movement
- route path visualization
The uploaded document highlights geo-enabled monitoring and activity tracking features, which support this live mapping view.
This screen helps supervisors instantly see:
- current rep location
- completed stops
- skipped outlets
- pending visits
6: Route Performance Table
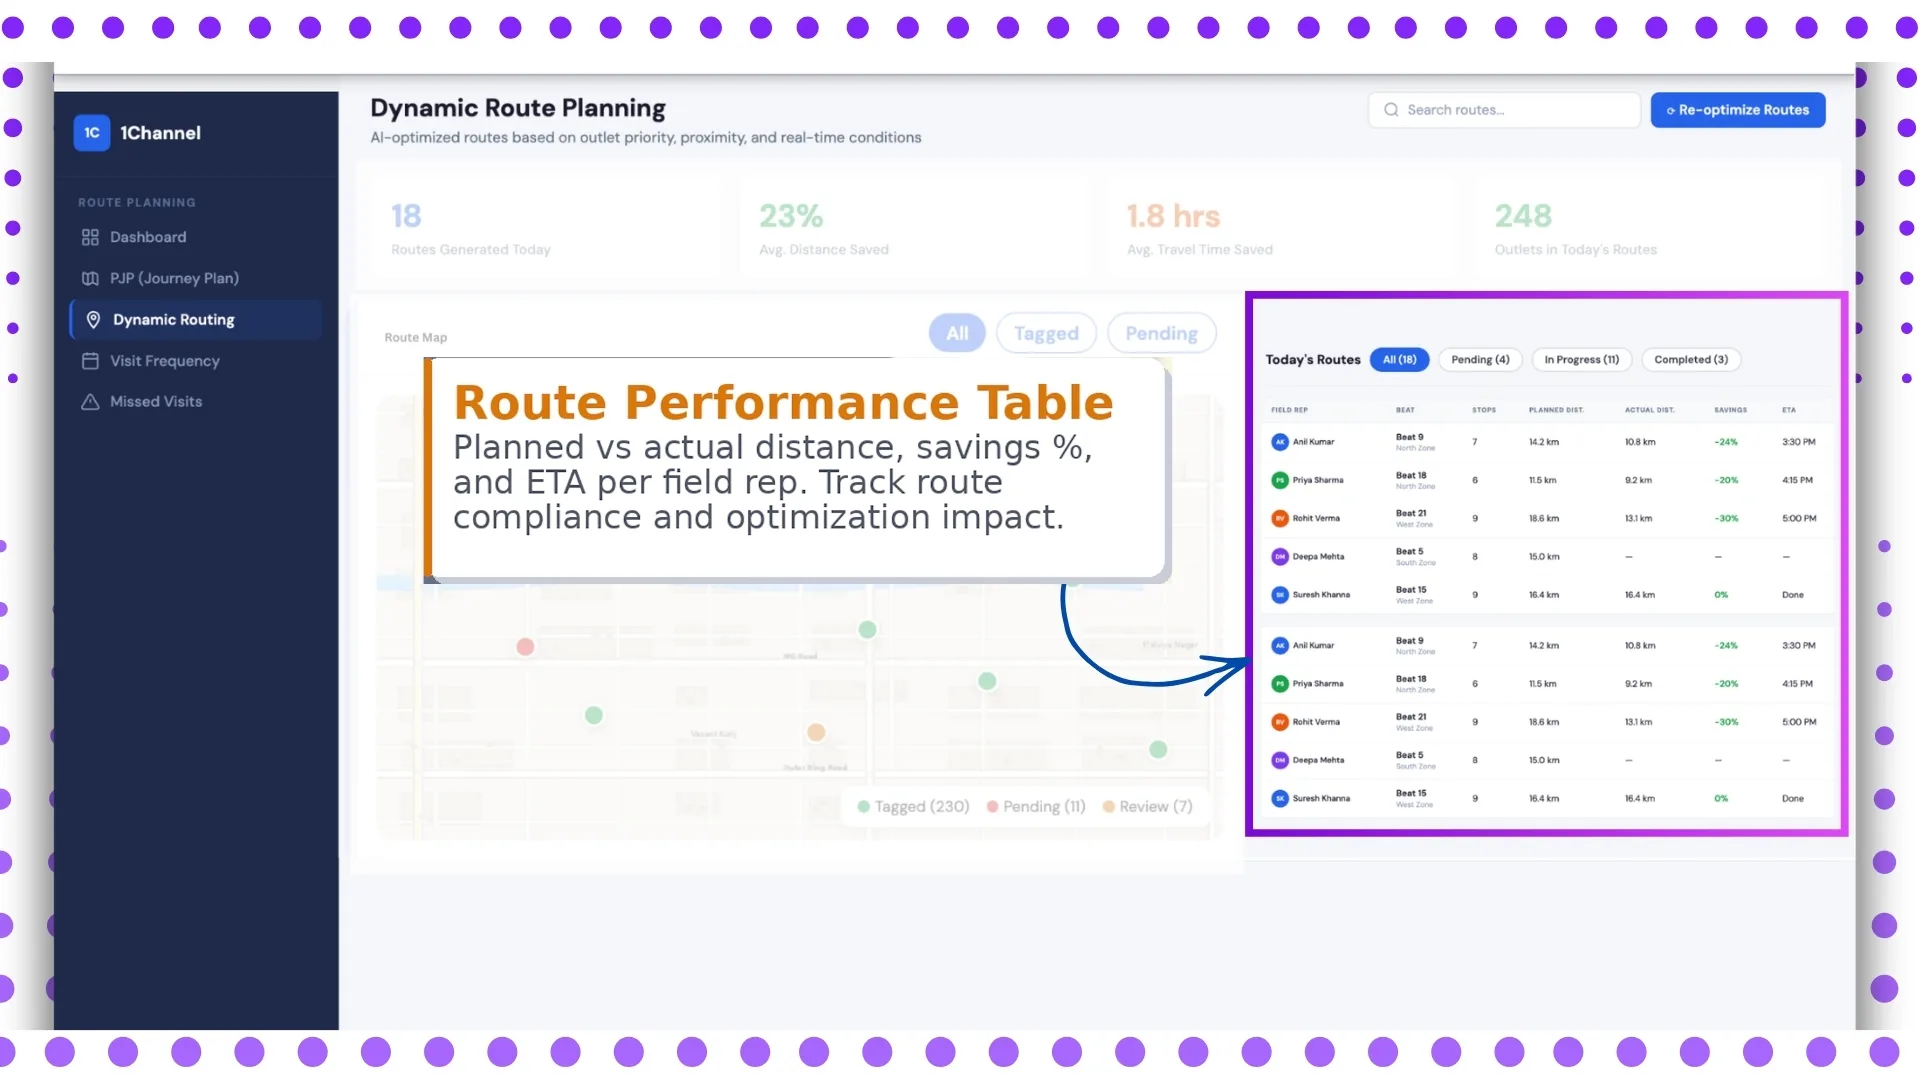
This screen is focused on route execution analysis.
Key Columns
- planned distance
- actual distance
- savings %
- ETA
- rep-wise performance
It helps answer practical questions like:
- Is the route realistic?
- Did the rep follow the shortest path?
- How much time was saved?
This is extremely useful for optimizing future beat plans.
7: Visit Frequency Dashboard
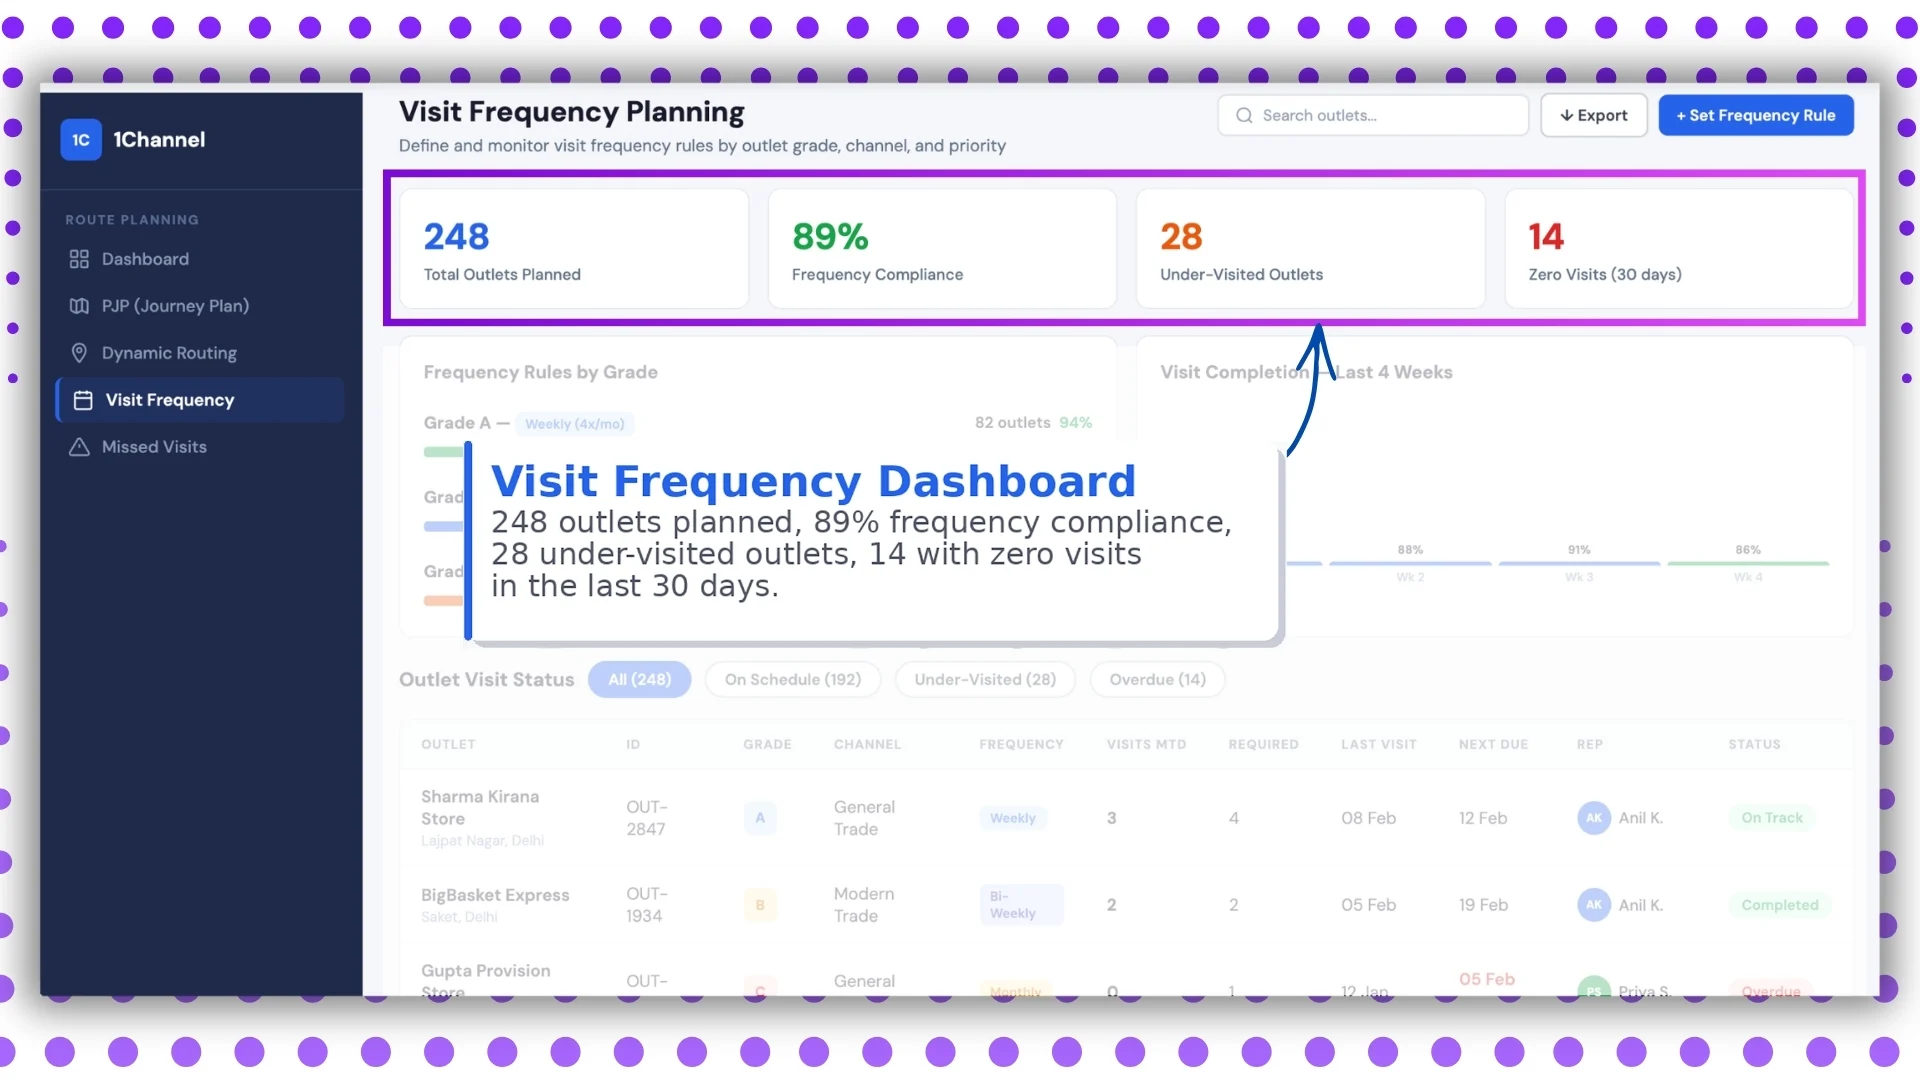
Outlet visit consistency is a major part of beat compliance.
This screen tracks:
- 248 outlets planned
- 89% frequency compliance
- 28 under-visited outlets
- 14 zero-visit outlets in last 30 days
This connects directly with outlet servicing quality and sales continuity.
Managers can instantly identify stores that are being neglected.
8: Grade-Based Frequency Rules
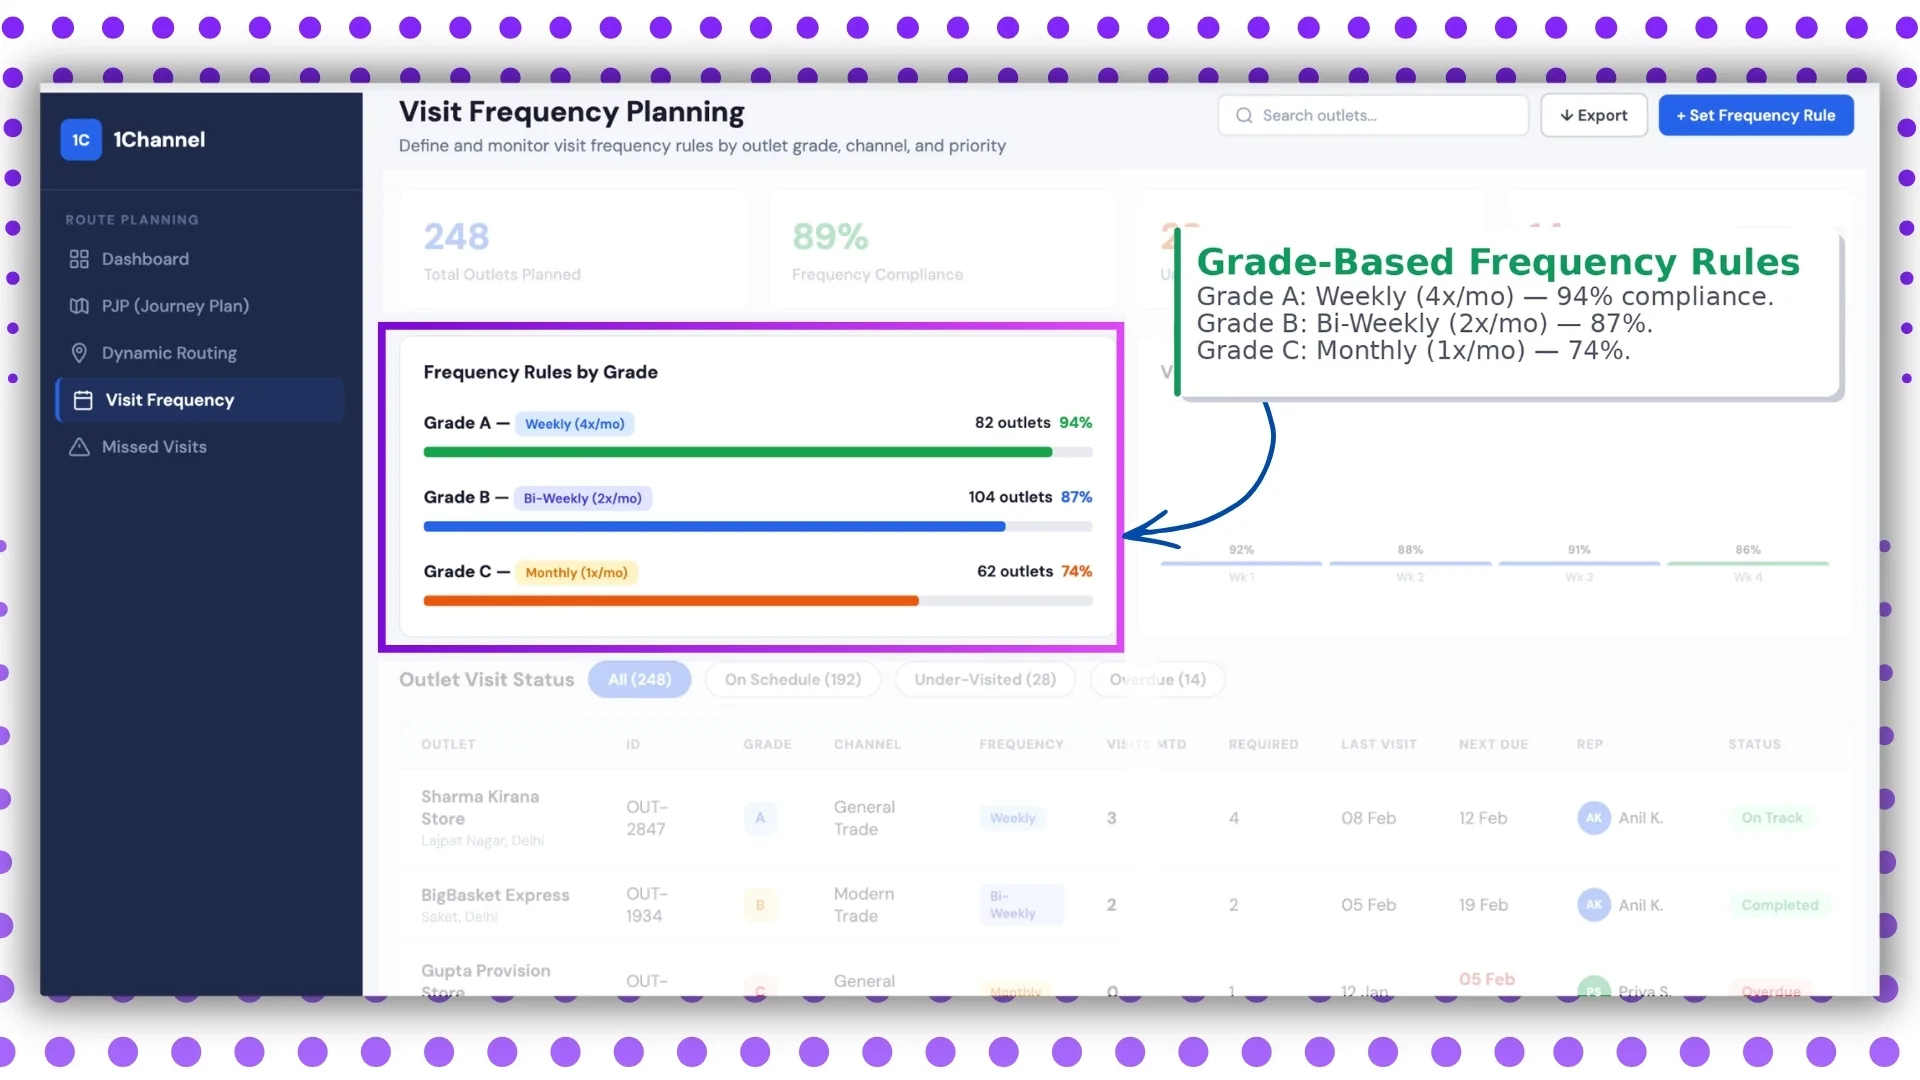
Not all outlets need the same visit frequency.
This screen breaks outlet visits based on priority grades.
Example Rules
- Grade A: Weekly (4x/month) - 94%
- Grade B: Bi-weekly (2x/month) - 87%
- Grade C: Monthly (1x/month) - 74%
This helps ensure premium outlets receive higher servicing frequency.
9: Outlet Visit Status
This screen provides store-level compliance.
Visible Data
- visits MTD
- required visits
- last visit date
- next due
- assigned rep
- status
Status Examples
- On Track
- Completed
- Overdue
This is extremely useful for store-wise accountability.
10: Missed Visit Recovery Dashboard
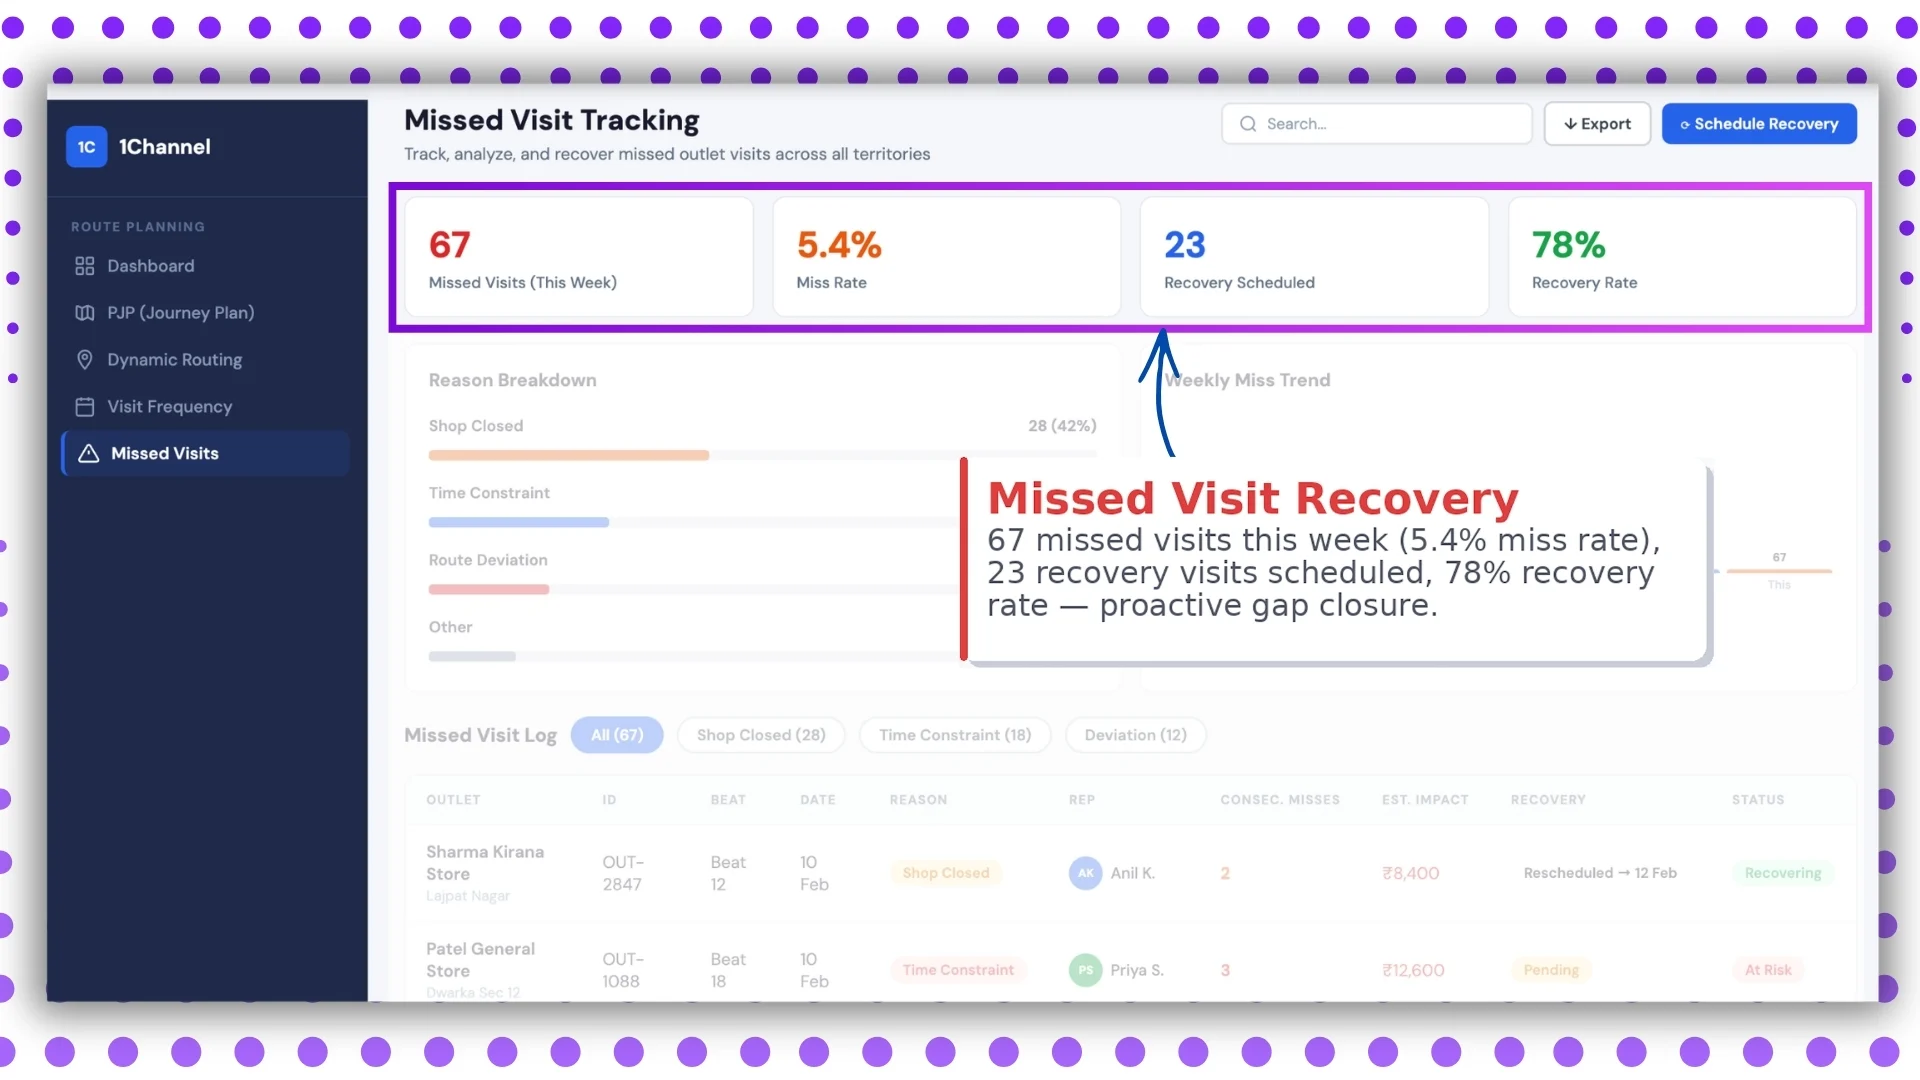
Missed visits are unavoidable in field operations.
What matters is recovery speed.
Metrics
- 67 missed visits
- 5.4% miss rate
- 23 recovery visits scheduled
- 78% recovery rate
This screen focuses on proactive gap closure.
11: Missed Visit Reasons & Trend
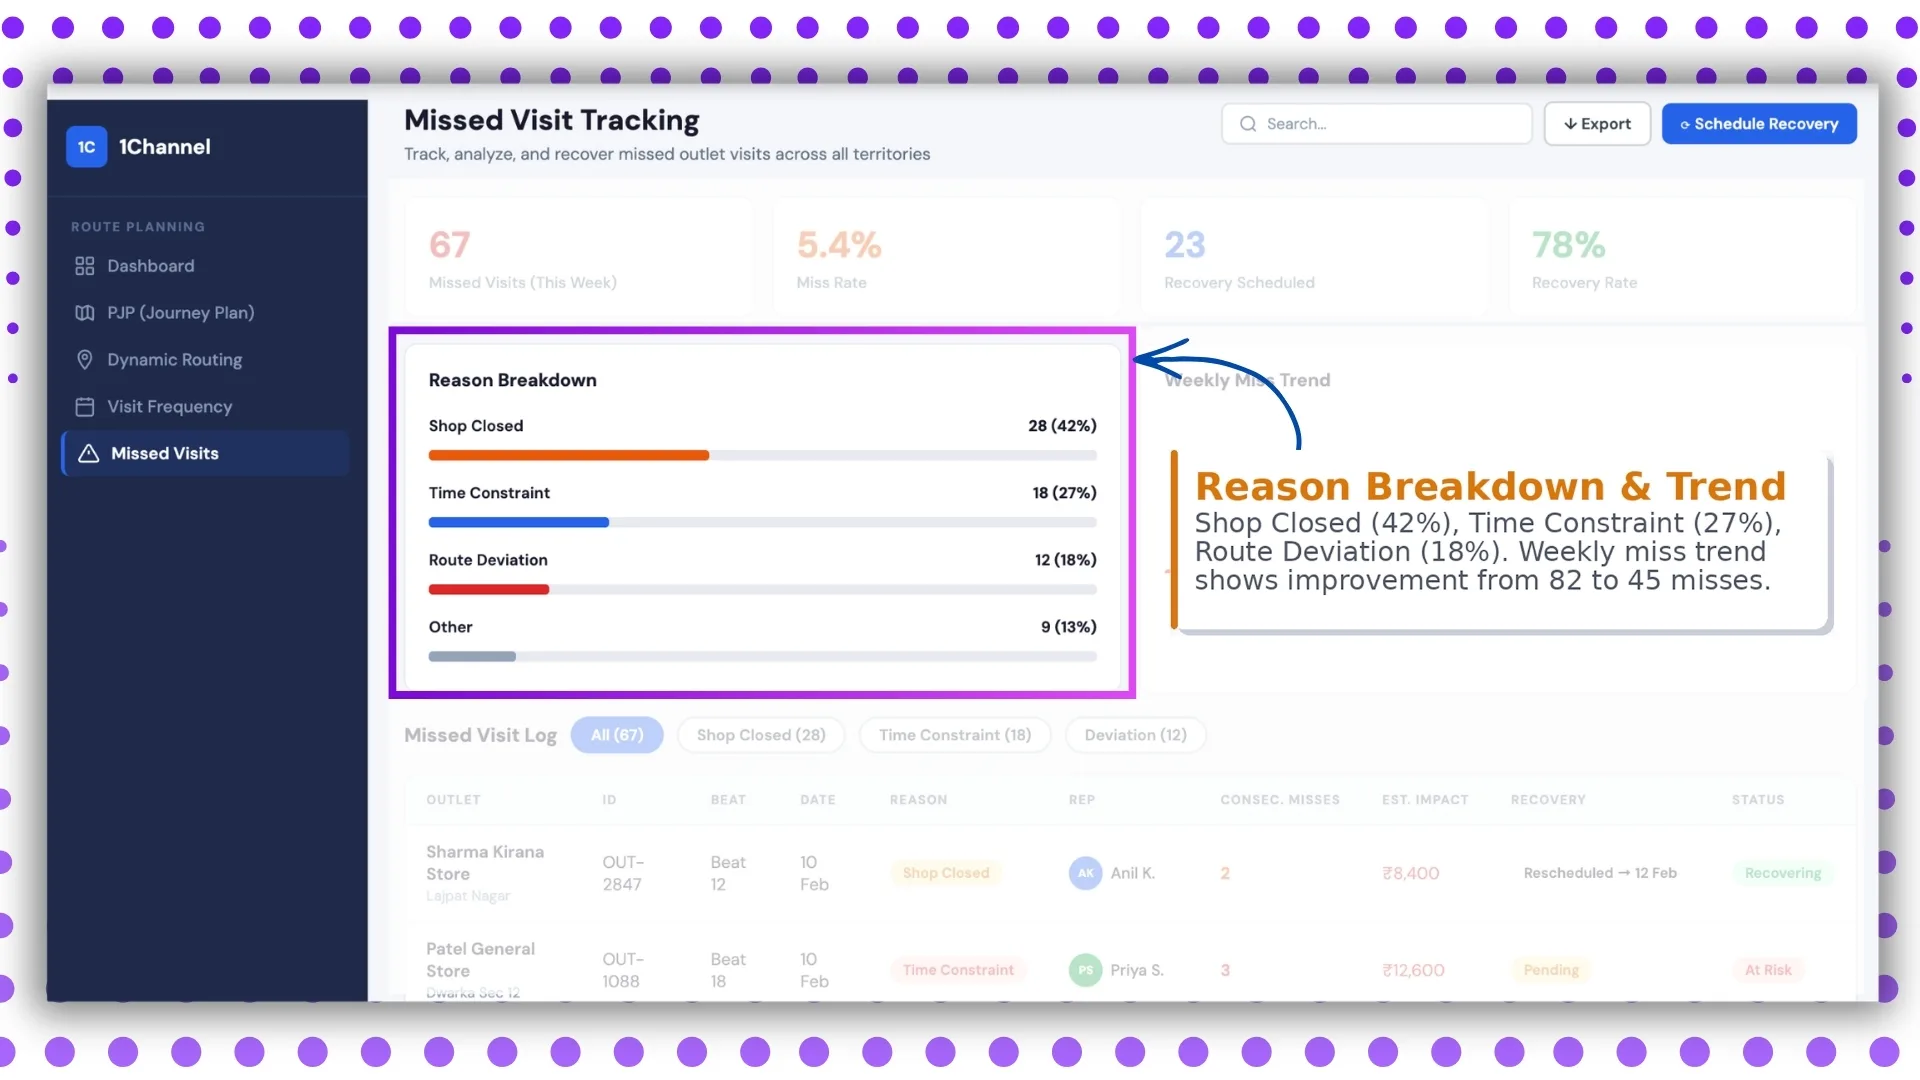
This screen helps managers understand why visits are being missed.
Breakdown
- Shop Closed – 42%
- Time Constraint – 27%
- Route Deviation – 18%
It also shows weekly trend improvement:
82 missed visits → 45 missed visits
This is useful for operational strategy and team coaching.
12: Missed Visit Log
This is the detailed outlet-level tracking screen.
It includes:
- outlet name
- reason tag
- consecutive misses
- revenue impact
- recovery schedule
This makes the dashboard highly actionable instead of just analytical.
How This Dashboard Improves Field Sales Operations
A beat compliance dashboard helps businesses improve:
- route discipline
- outlet coverage
- rep productivity
- travel efficiency
- missed visit recovery
- frequency compliance
It transforms field operations from manual supervision into measurable execution.
Why Choose 1Channel SFA for Beat Compliance Visibility?
1Channel SFA helps businesses build a powerful beat compliance and journey plan monitoring framework through advanced SFA dashboards, route analytics, market visit planning, and compliance reporting.
With configurable dashboards, weekday beat planning, route adherence reports, and live field visibility, businesses can manage outlet coverage with complete control and accuracy.
This helps sales teams improve discipline, reduce missed visits, and maximize field productivity at scale.
Master Beat Compliance with Sales Force Automation
1Channel Sales Force Automation provides comprehensive beat compliance monitoring with journey plan KPIs, route optimization, live GPS tracking, visit frequency management, and missed visit recovery analytics to help your field teams execute with precision.
Explore Sales Force Automation →FAQs
What is beat compliance in field sales?
Beat compliance measures how many assigned outlets were actually visited by a field representative during the planned route.
How is beat compliance calculated?
It is calculated as:
stores visited ÷ stores planned × 100
This definition is also mentioned in the provided SFA document.
Why is route optimization important?
It helps reduce travel distance, save time, and increase outlet coverage per day.
Can managers track missed visits?
Yes, the dashboard includes missed visit trends, reasons, and recovery scheduling.
Does it support weekday planning?
Yes, the document explicitly includes weekday-based market visit planning and beat plan management.