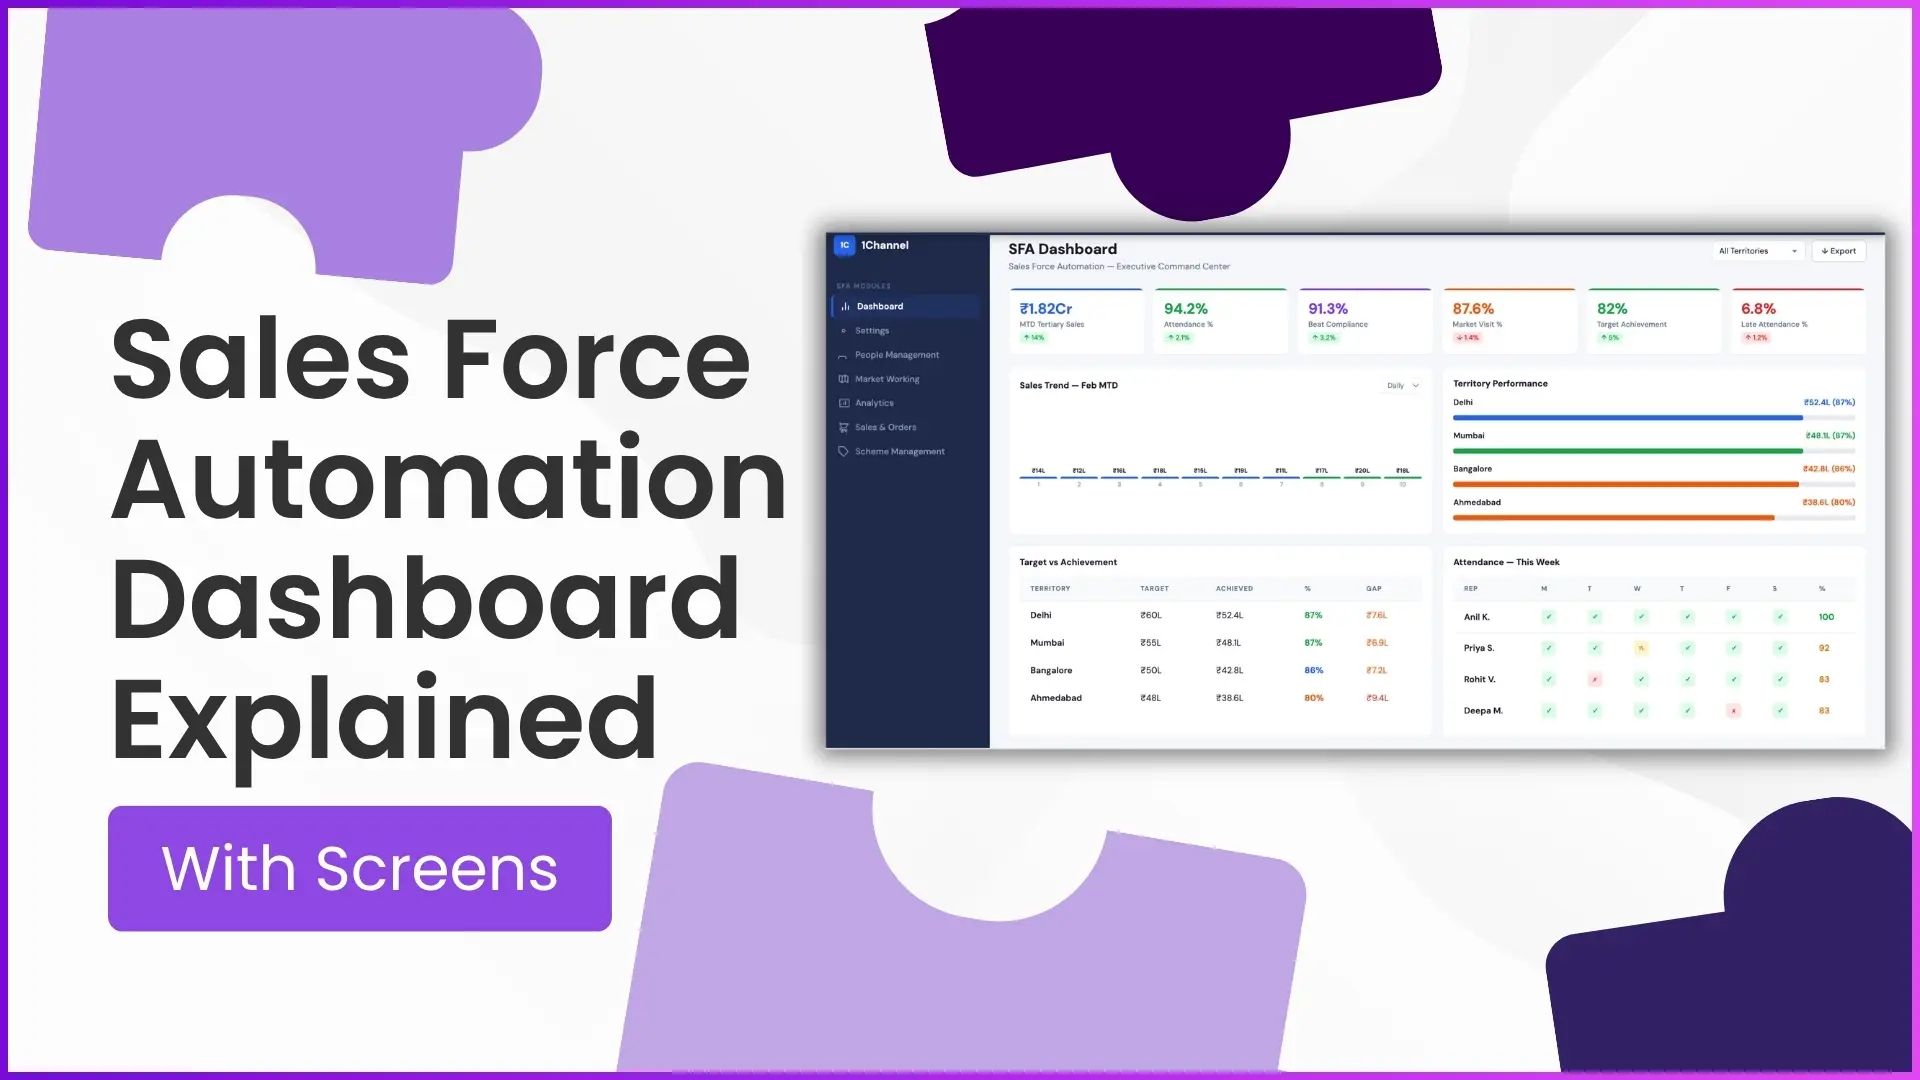
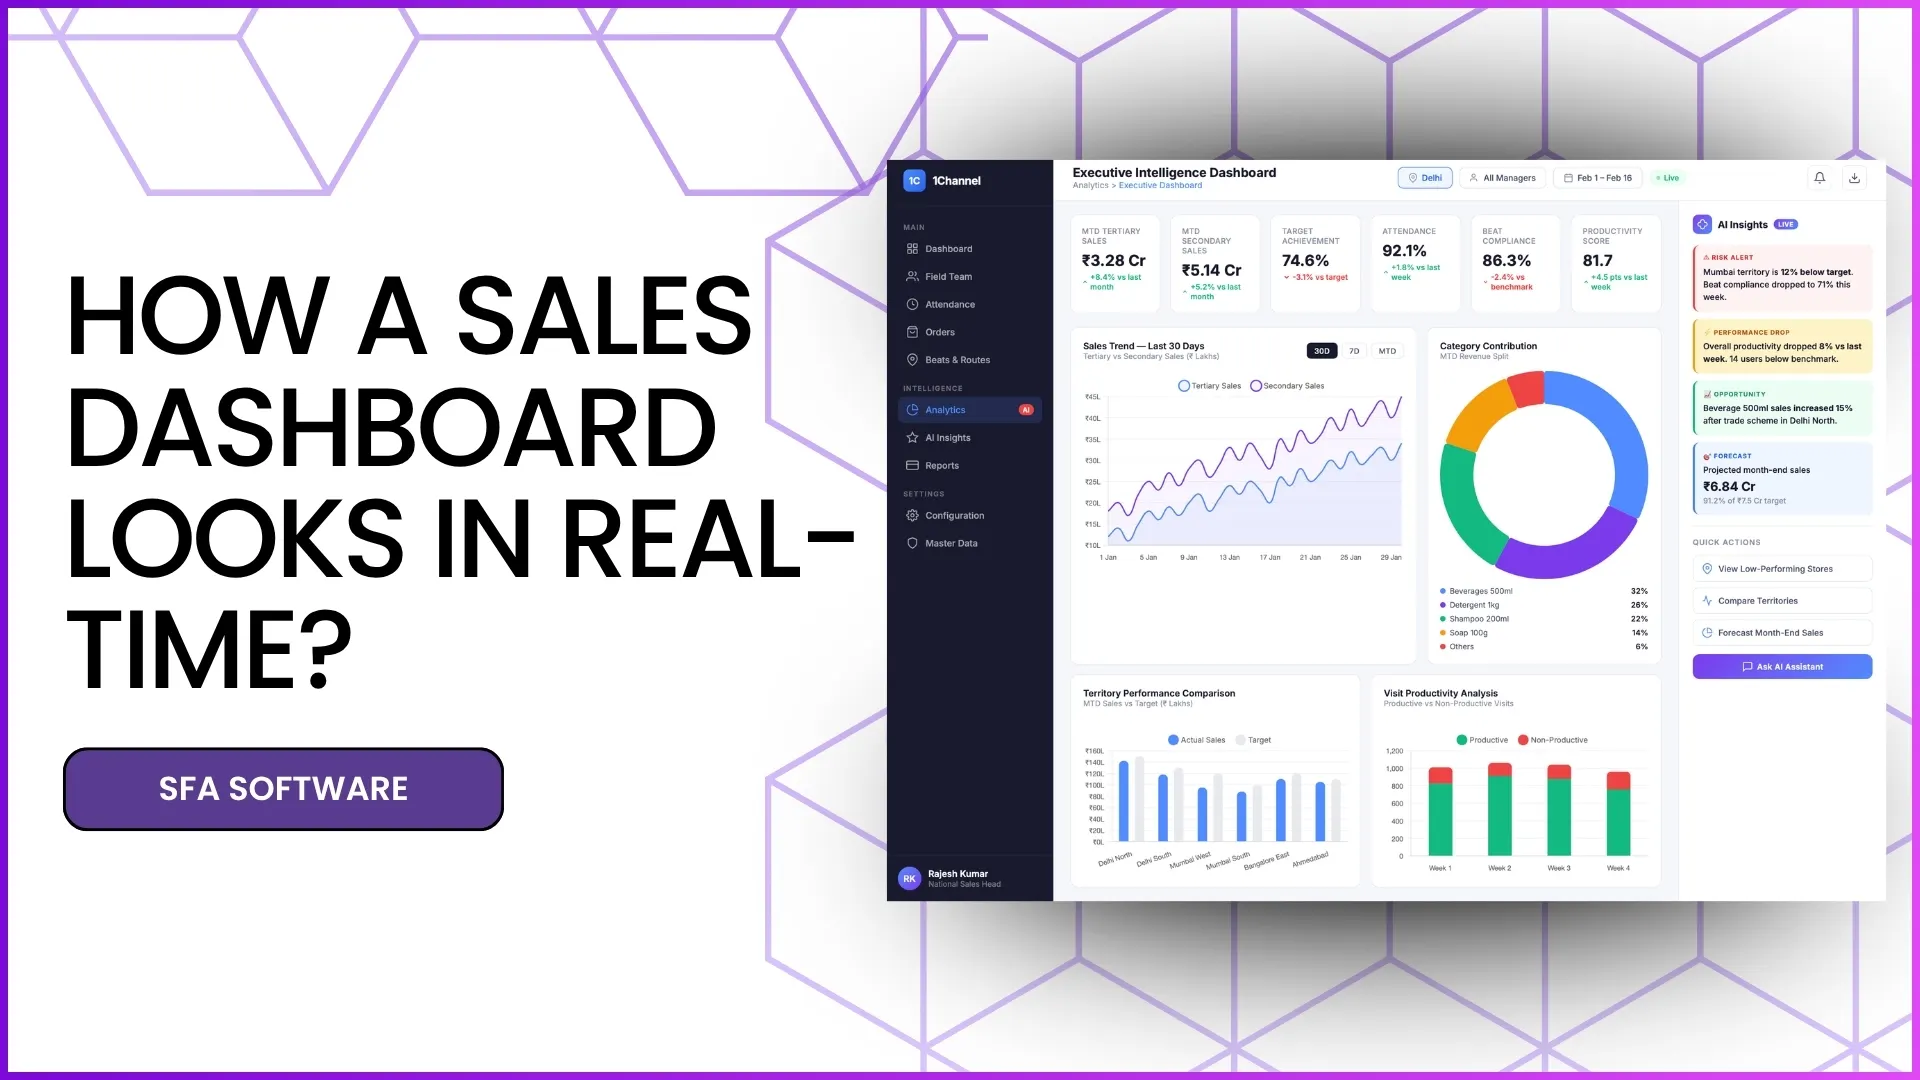
A real-time sales dashboard is the first thing that gives business leaders clarity over their field operations, sales movement, and team productivity.
In a Sales Force Automation (SFA) system, the dashboard is not just a screen with numbers it acts as a live control centre where managers can track sales, attendance, field visits, territory performance, and business trends from a single interface.
As per the uploaded SFA document, the Advanced Dashboard is the default first screen visible on portal login and is fully configurable based on business requirements.
Let's understand how a real-time sales dashboard actually looks and what it includes.
Executive KPI Command Centre
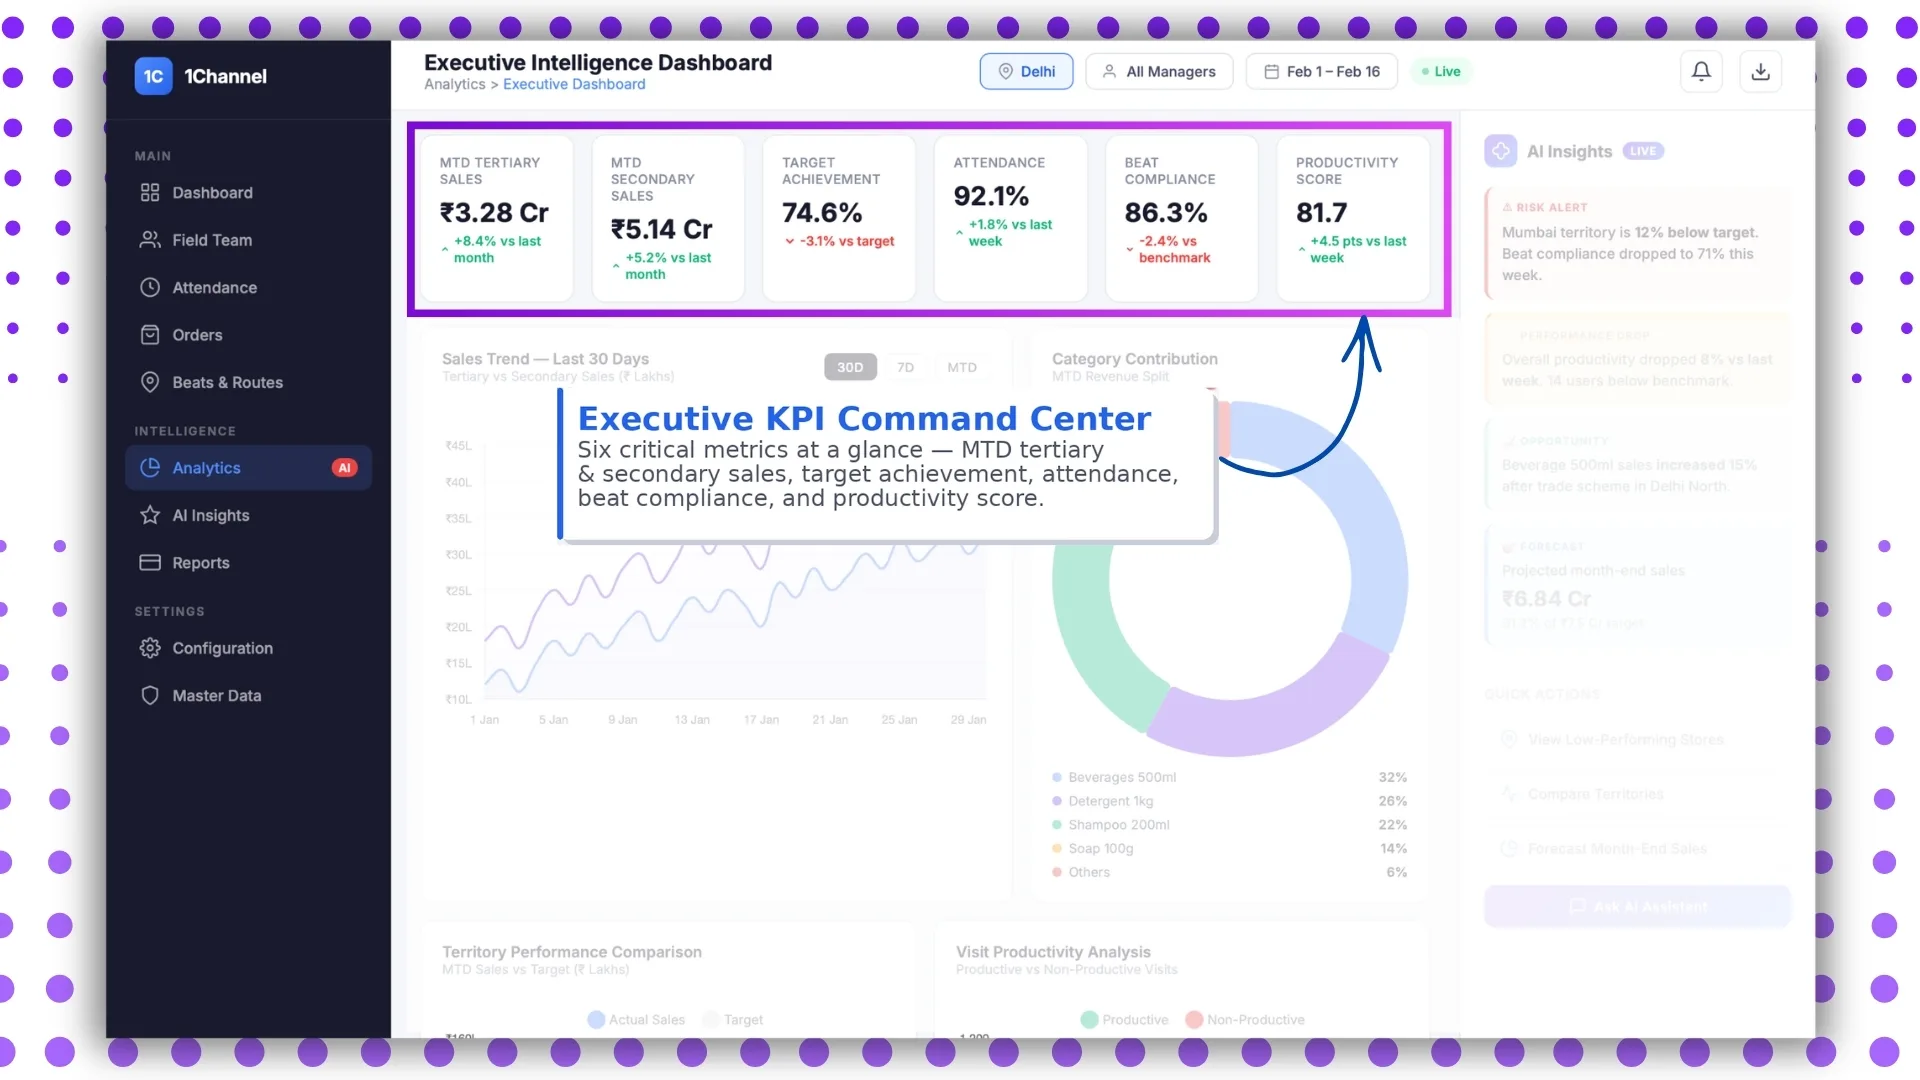
The first layer of a real-time sales dashboard is the KPI command centre, where the most important metrics are visible instantly.
This includes critical business indicators such as:
- MTD tertiary sales
- MTD secondary sales
- target achievement
- attendance reporting percentage
- beat compliance
- productivity score
The uploaded SFA document confirms that the advanced dashboard contains analytics-based reporting data and attendance insights as the default view.
This gives sales managers immediate visibility into:
- how much sales have been achieved
- how the field team is performing
- whether targets are being met
- where corrective action is needed
Explore Sales Analytics Software
Track real-time KPIs, sales trends, attendance metrics, territory performance, and productivity insights with advanced analytics capabilities.
Learn More About Sales Analytics →Real-Time Attendance and Compliance Dashboard
One of the most important parts of the dashboard is the attendance analytics panel.
According to the uploaded file, the dashboard includes detailed attendance metrics such as:
- attendance reporting percentage
- present reporting percentage
- late attendance percentage
- market visit percentage
- not marked defaulter percentage
It also provides a calendar-based attendance view and detailed employee-level compliance records.
This section helps managers monitor:
- daily attendance trends
- punctuality issues
- missed check-ins
- field presence compliance
For field-heavy businesses, this becomes one of the most actively used real-time dashboard sections.
Sales Trend View: 30D, 7D and MTD
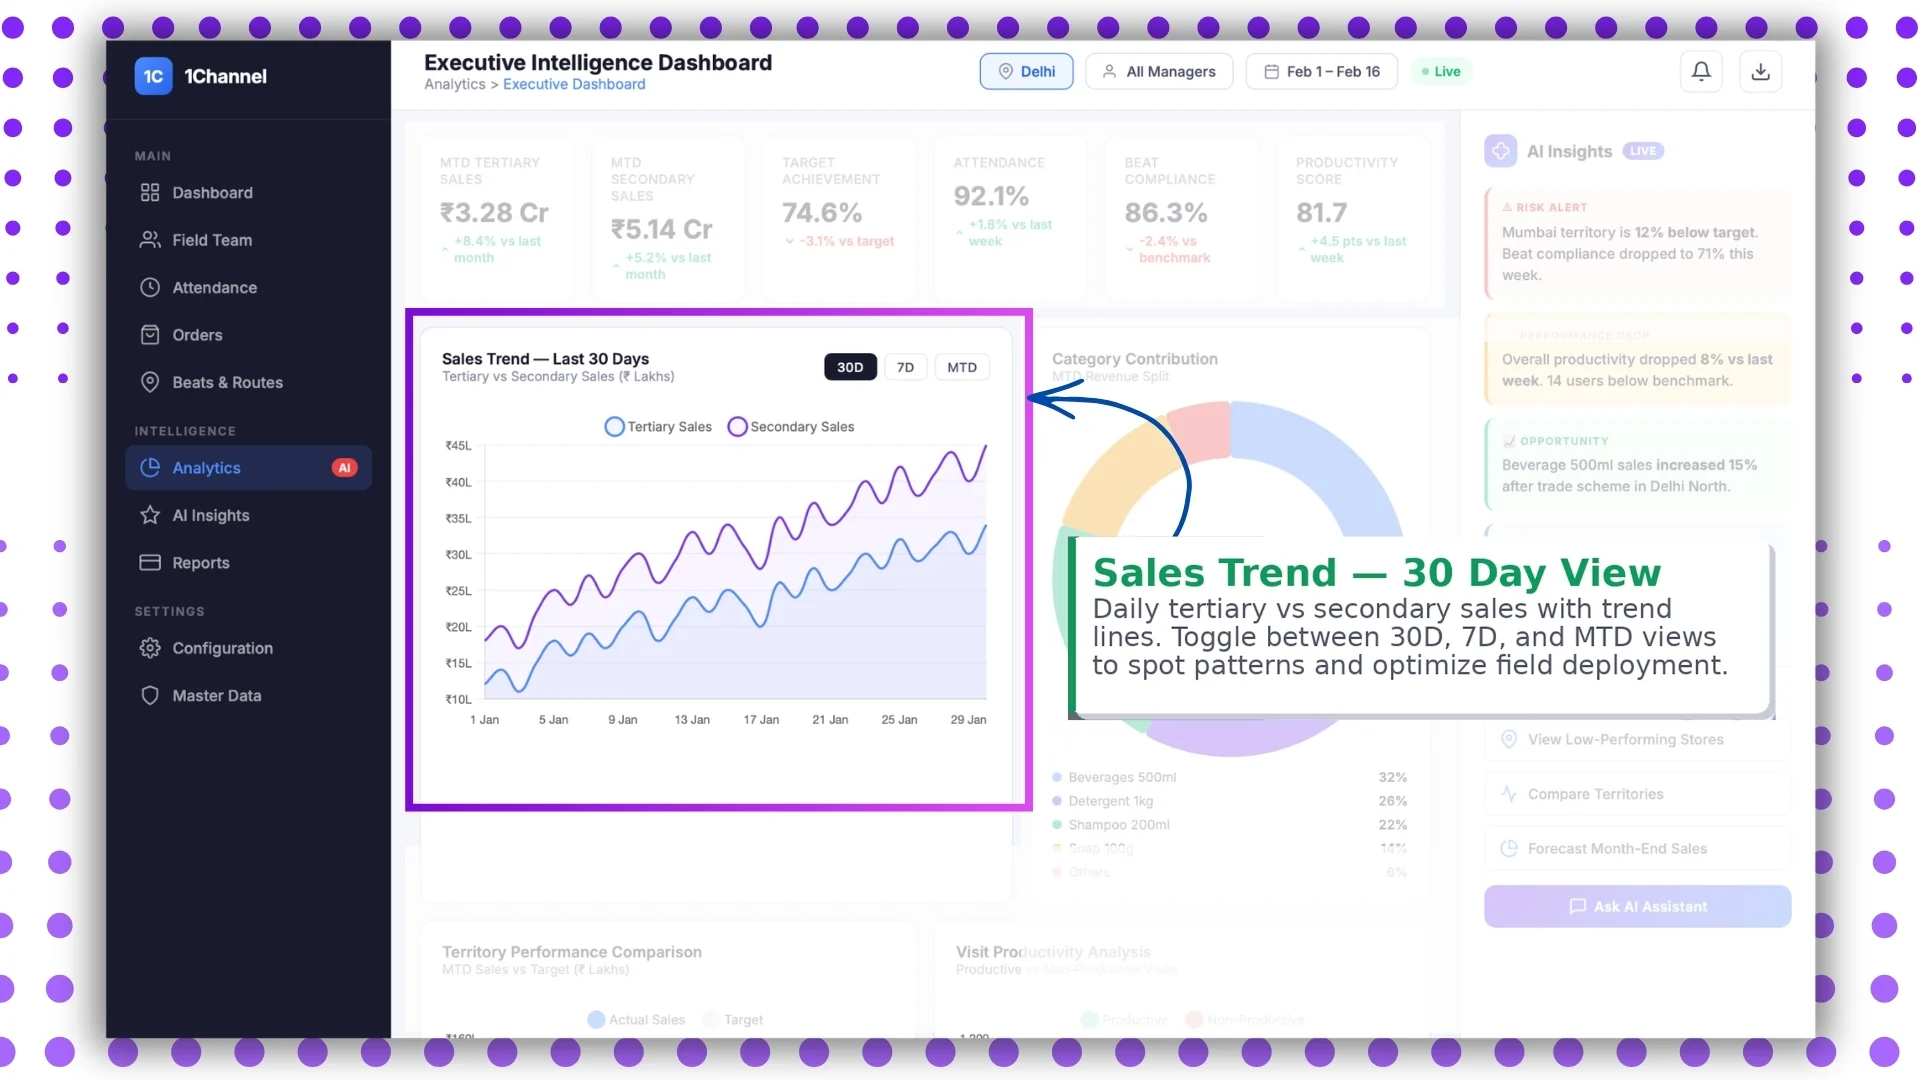
A strong sales dashboard must help identify performance patterns.
This is where the sales trend chart becomes highly useful.
The dashboard can show:
- daily tertiary sales
- daily secondary sales
- trend lines
- performance fluctuations
Using filters like:
- 30D
- 7D
- MTD
managers can quickly compare short-term and long-term trends.
This directly aligns with the MTD Tertiary Sales and MTD Secondary Sales reports mentioned in the uploaded SFA analytics section.
This helps in spotting:
- sales dips
- high-performing periods
- weekly patterns
- month-end acceleration
Category Revenue Split Dashboard
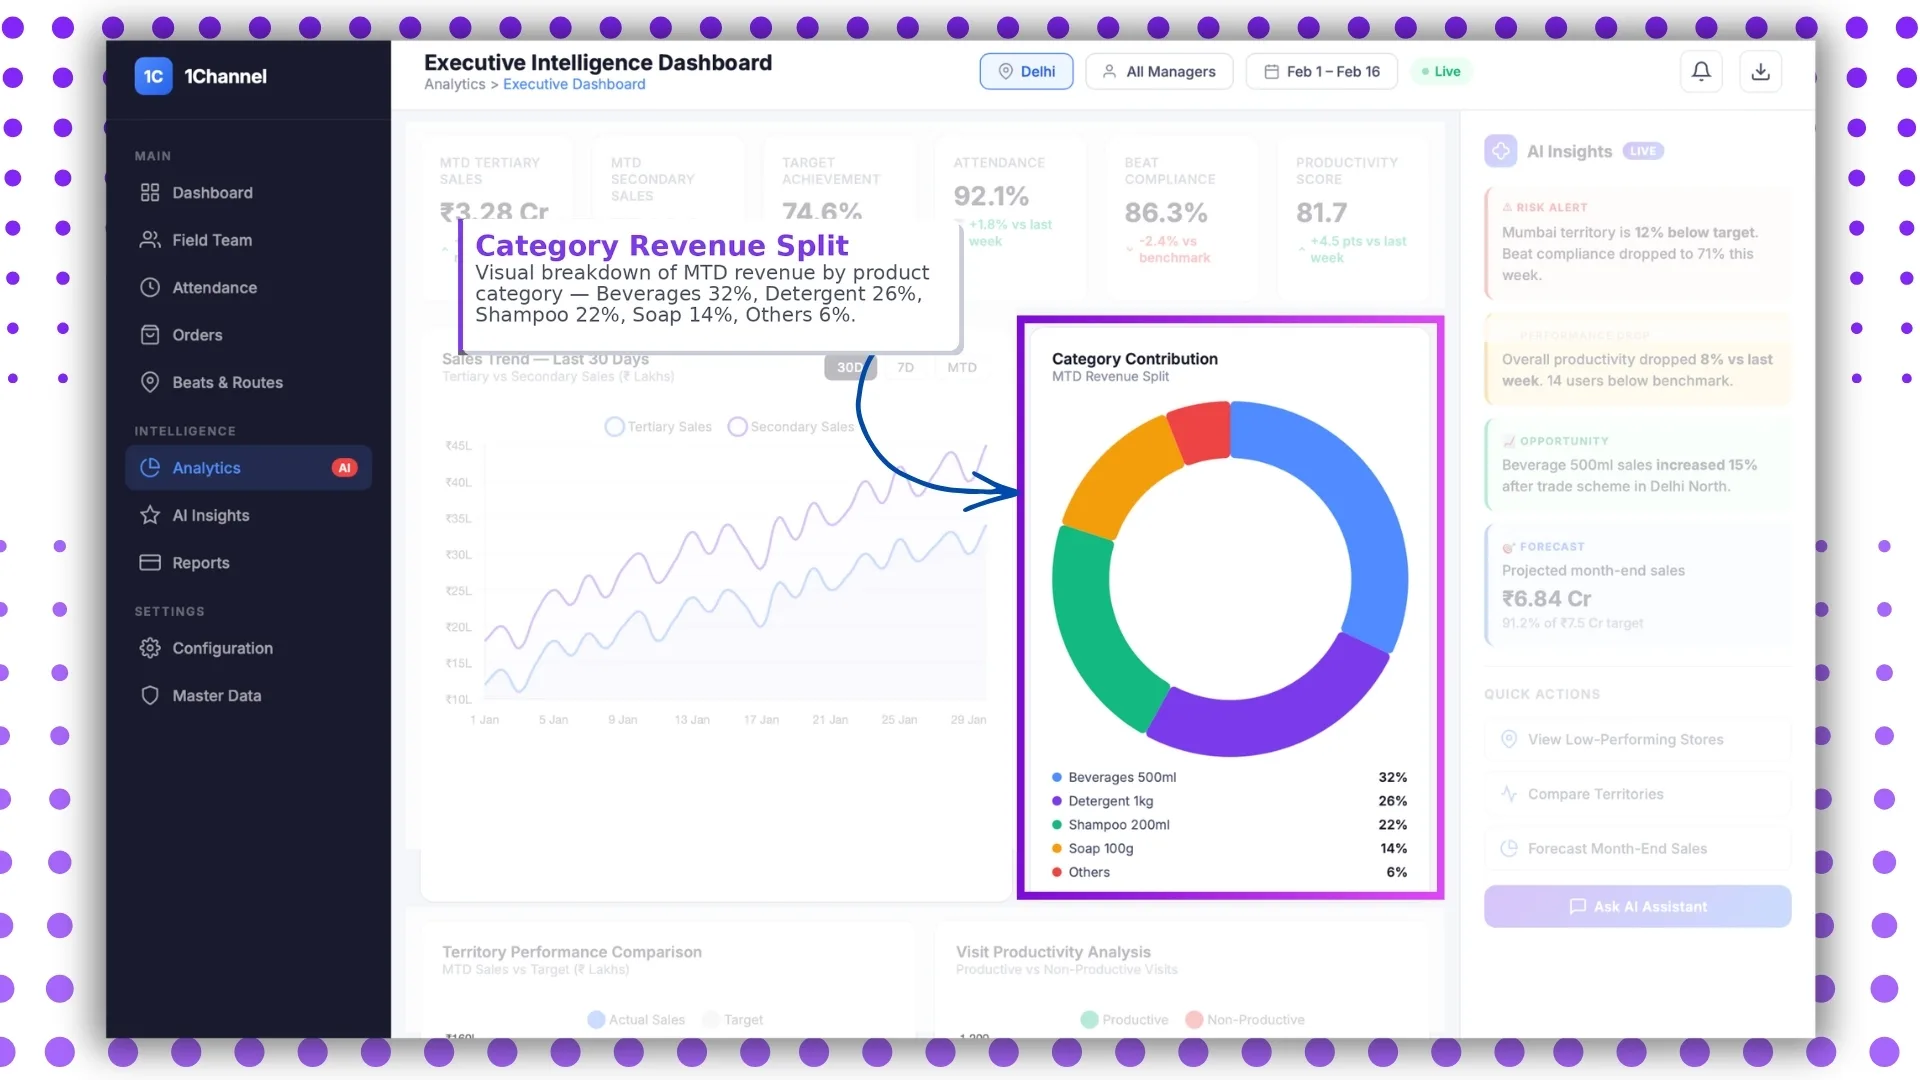
The analytics module in the uploaded document includes MTD Sales by Product Category reports.
This makes the category split section an important part of the real-time dashboard.
It visually breaks down revenue by product groups such as:
- beverages
- detergents
- shampoo
- soap
- others
This section helps businesses understand:
- which product categories are driving revenue
- where demand is growing
- which SKUs need stronger field push
It becomes especially useful for FMCG and retail sales teams.
AI-Powered Live Insights and Quick Actions
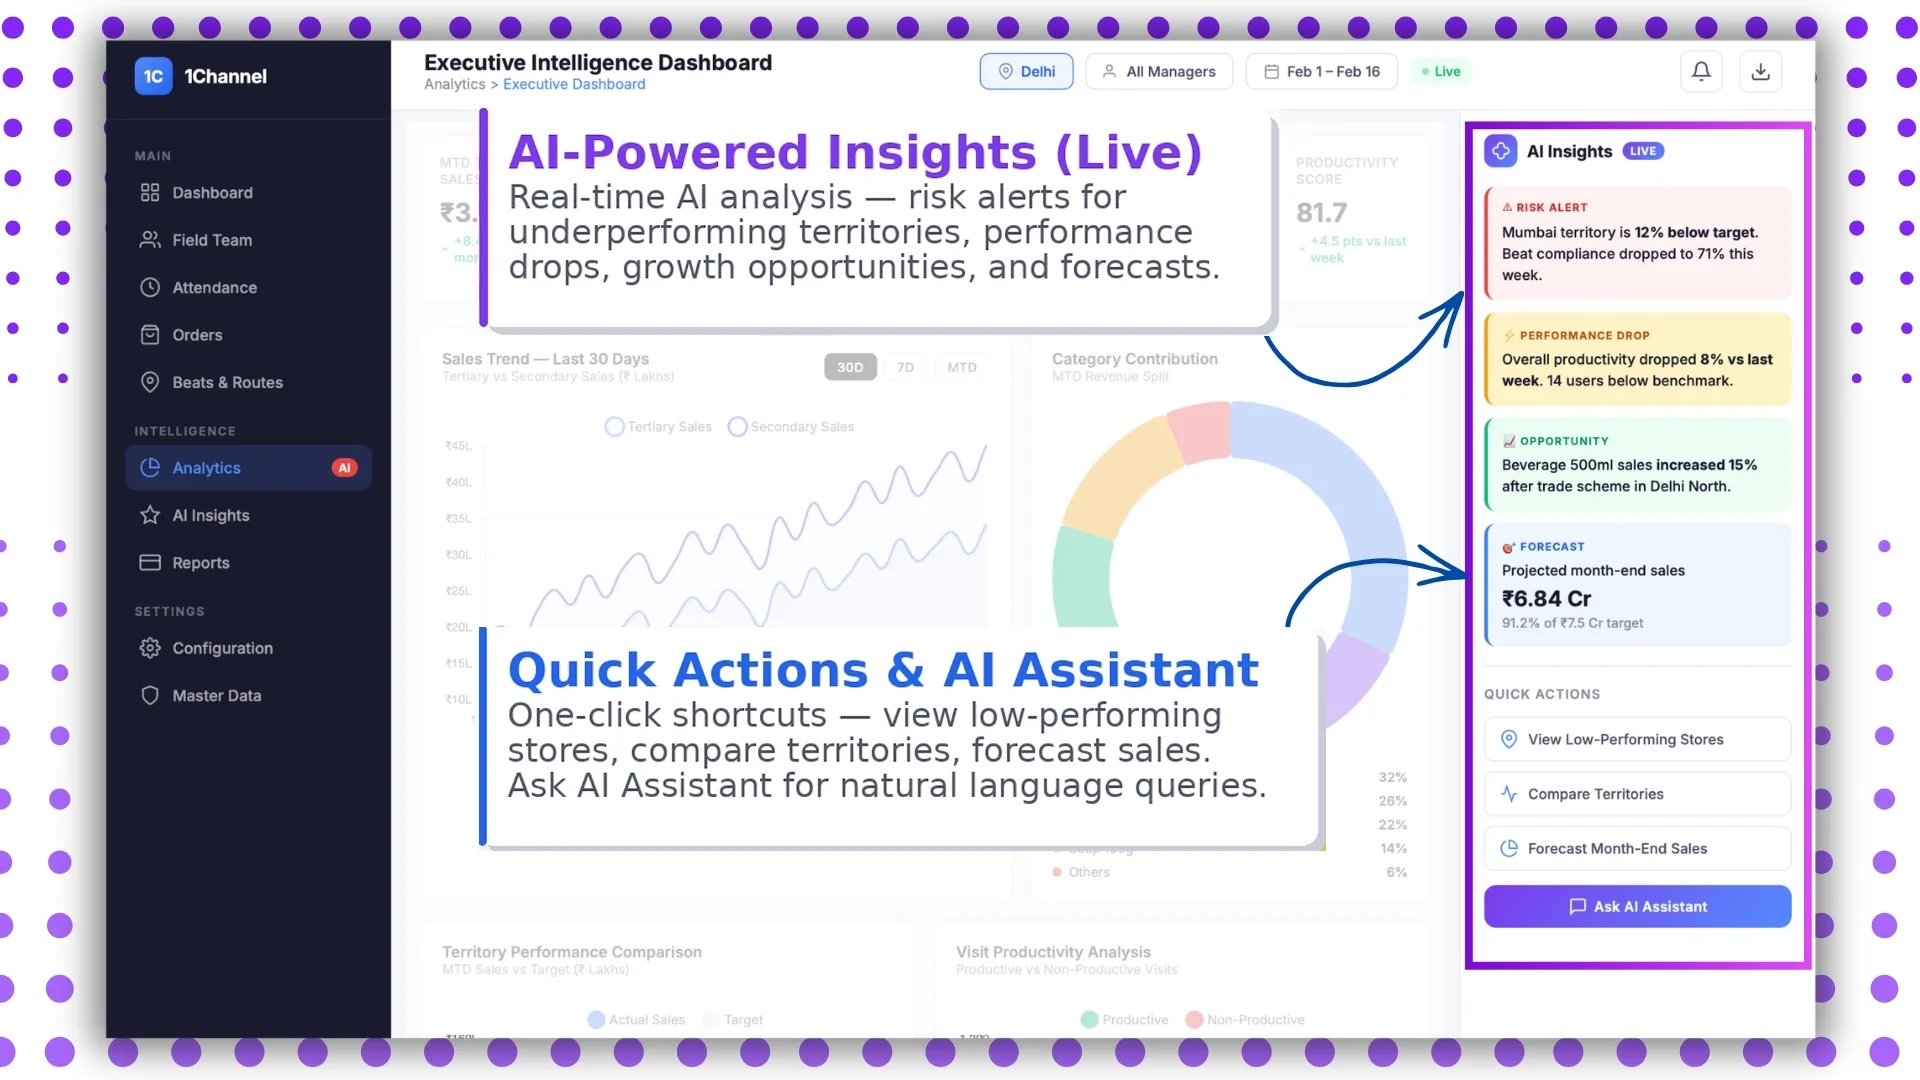
A modern dashboard should not only display data but also help users act on it.
The live insights section can highlight:
- low-performing territories
- sales drops
- target risk alerts
- visit productivity gaps
- growth opportunities
This works well with the analytics and custom reporting capability mentioned under Report Builder and Reports in the uploaded document.
Quick actions can include shortcuts like:
- compare territories
- check low-performing stores
- view productivity reports
- open attendance summary
This makes the dashboard more action-driven rather than only report-driven.
Territory Performance Comparison
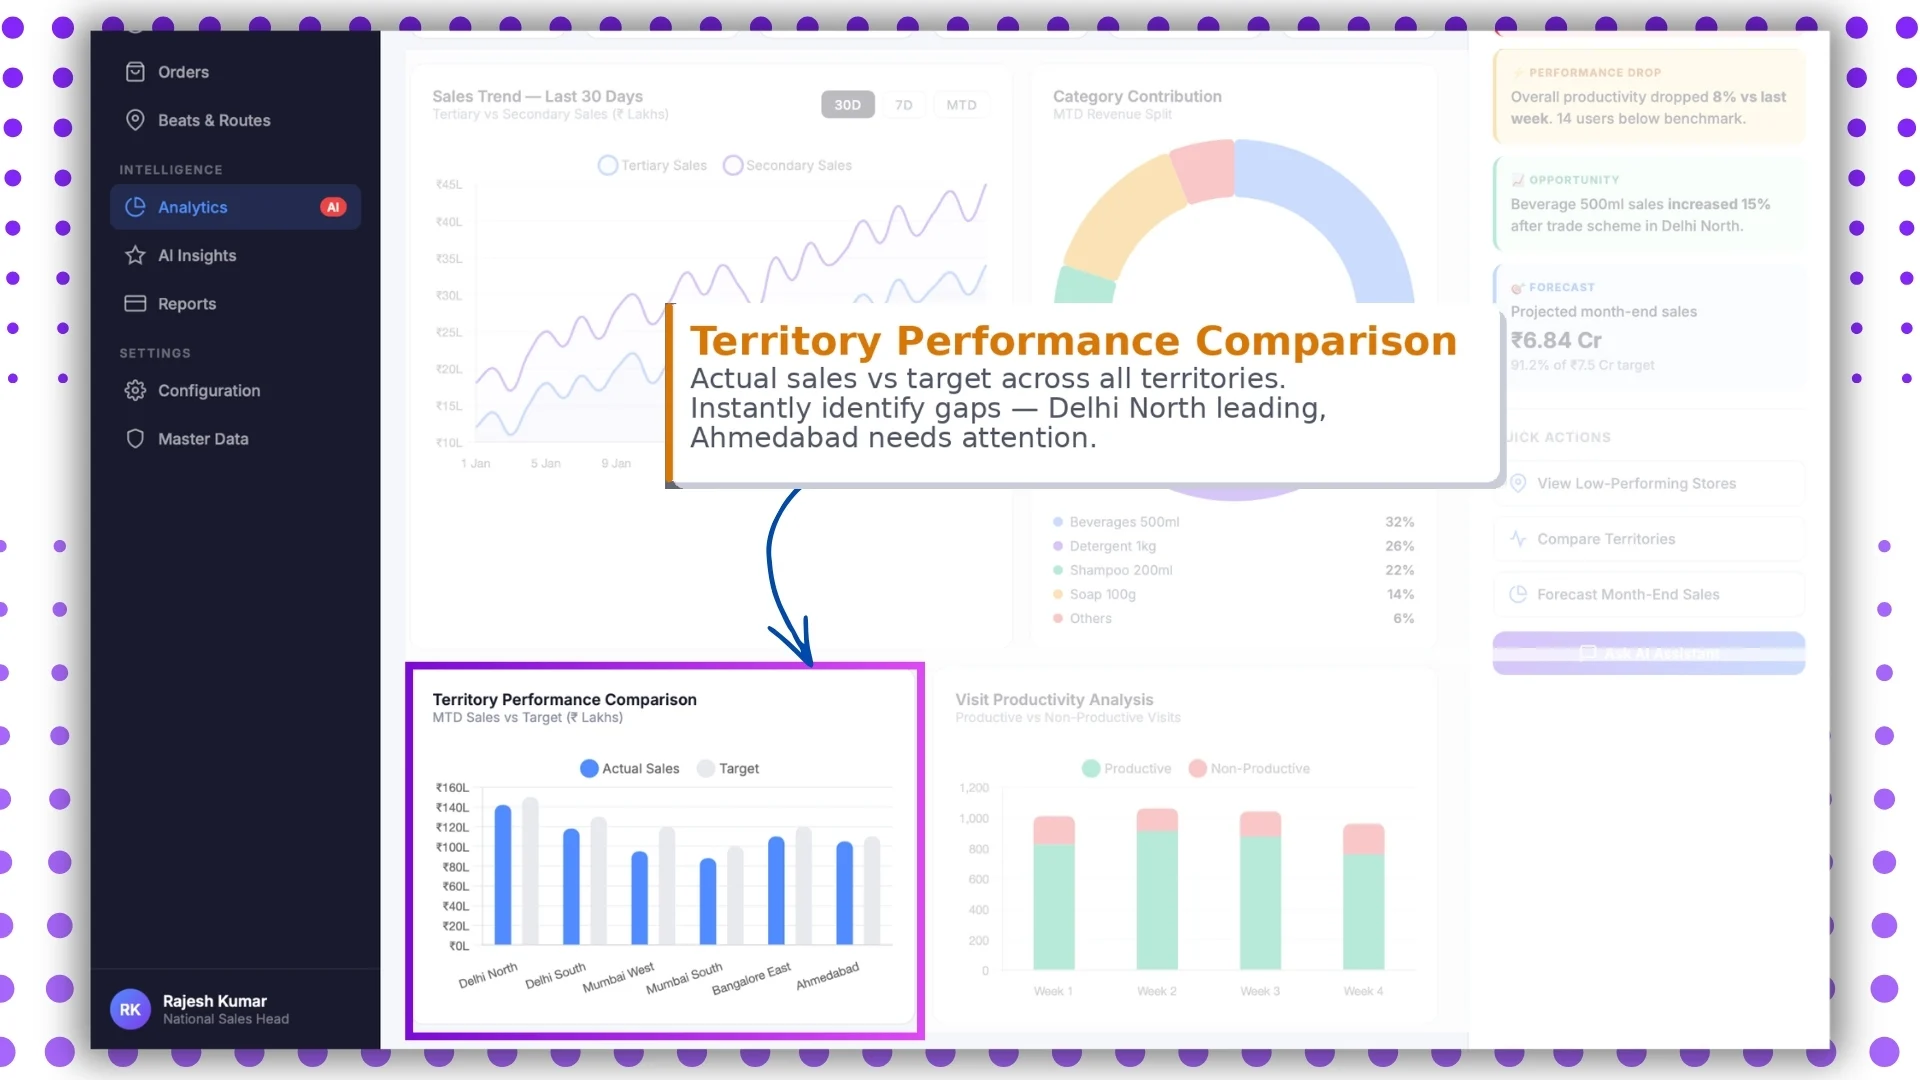
The uploaded SFA document clearly supports territory levels, territory names, store mapping, and user-role based reporting.
Because of this, a real-time sales dashboard often includes a territory comparison panel.
This helps compare:
- actual sales vs targets
- city-wise performance
- territory achievement %
- team-wise gaps
For example, managers can instantly identify which territory is leading and which one needs attention.
This improves decision-making at regional and zonal levels.
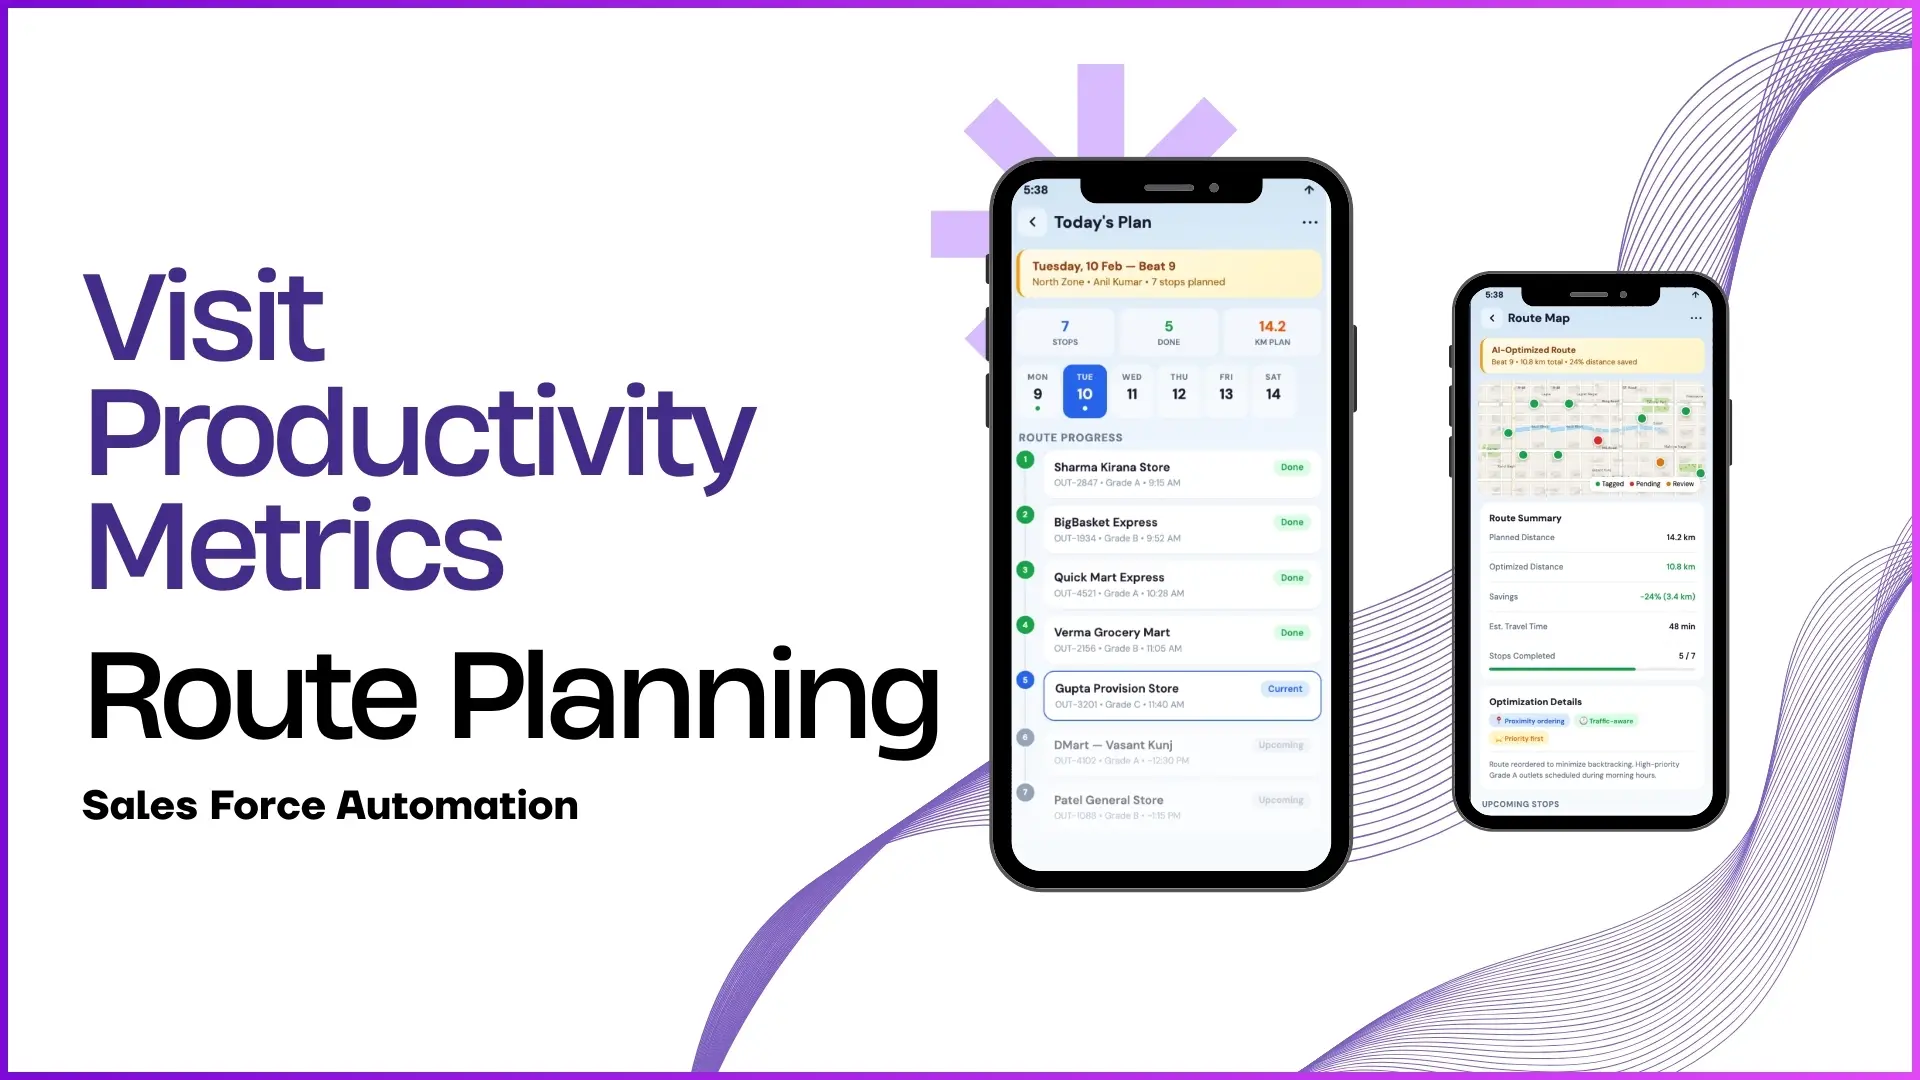
Visit Productivity Analysis
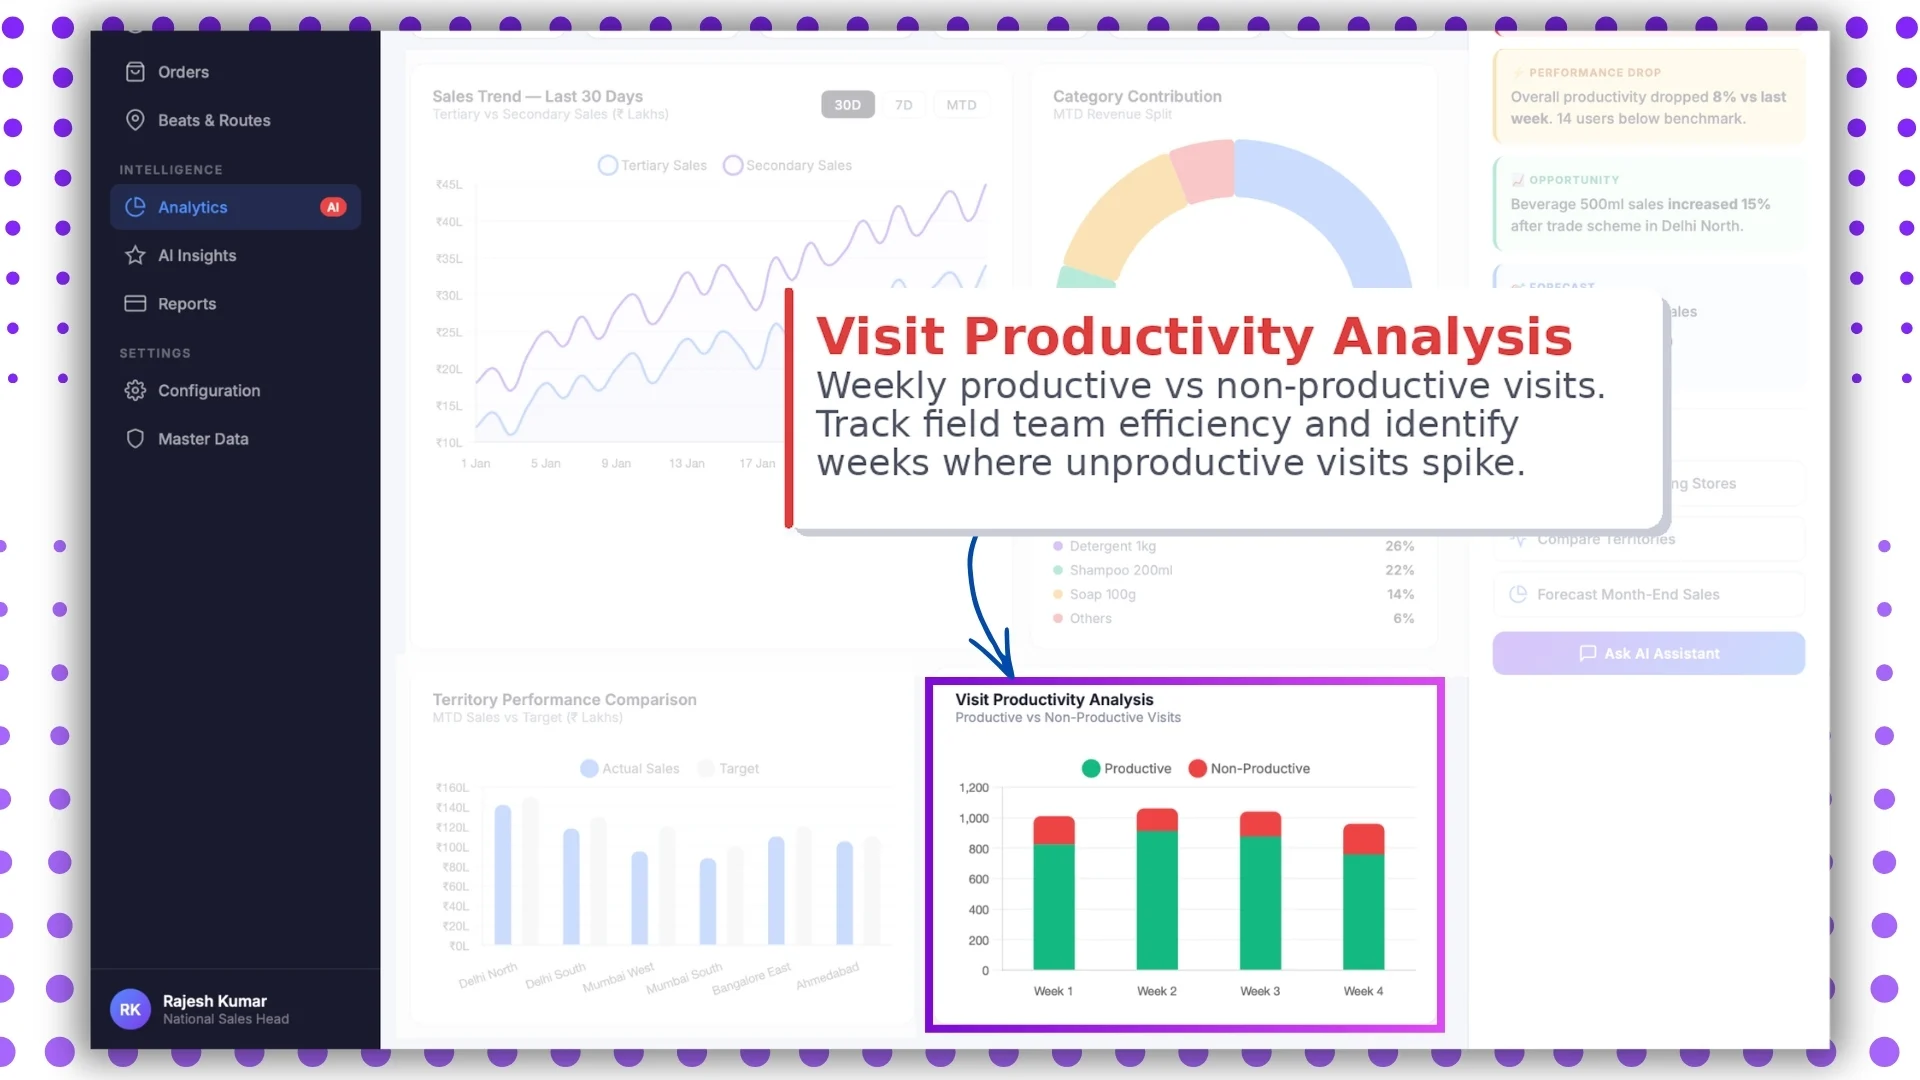
This is one of the strongest dashboard sections supported directly by the uploaded document.
The file explicitly includes:
- Visit Productivity Report
- Detailed Visit Productivity Report
- Sales Productivity Report
- User Activity Report
This section helps track:
- productive visits
- non-productive visits
- average stores visited
- activity-level performance
Managers can identify weeks where productivity drops and improve route planning accordingly.
Smart Filters and Live Mode
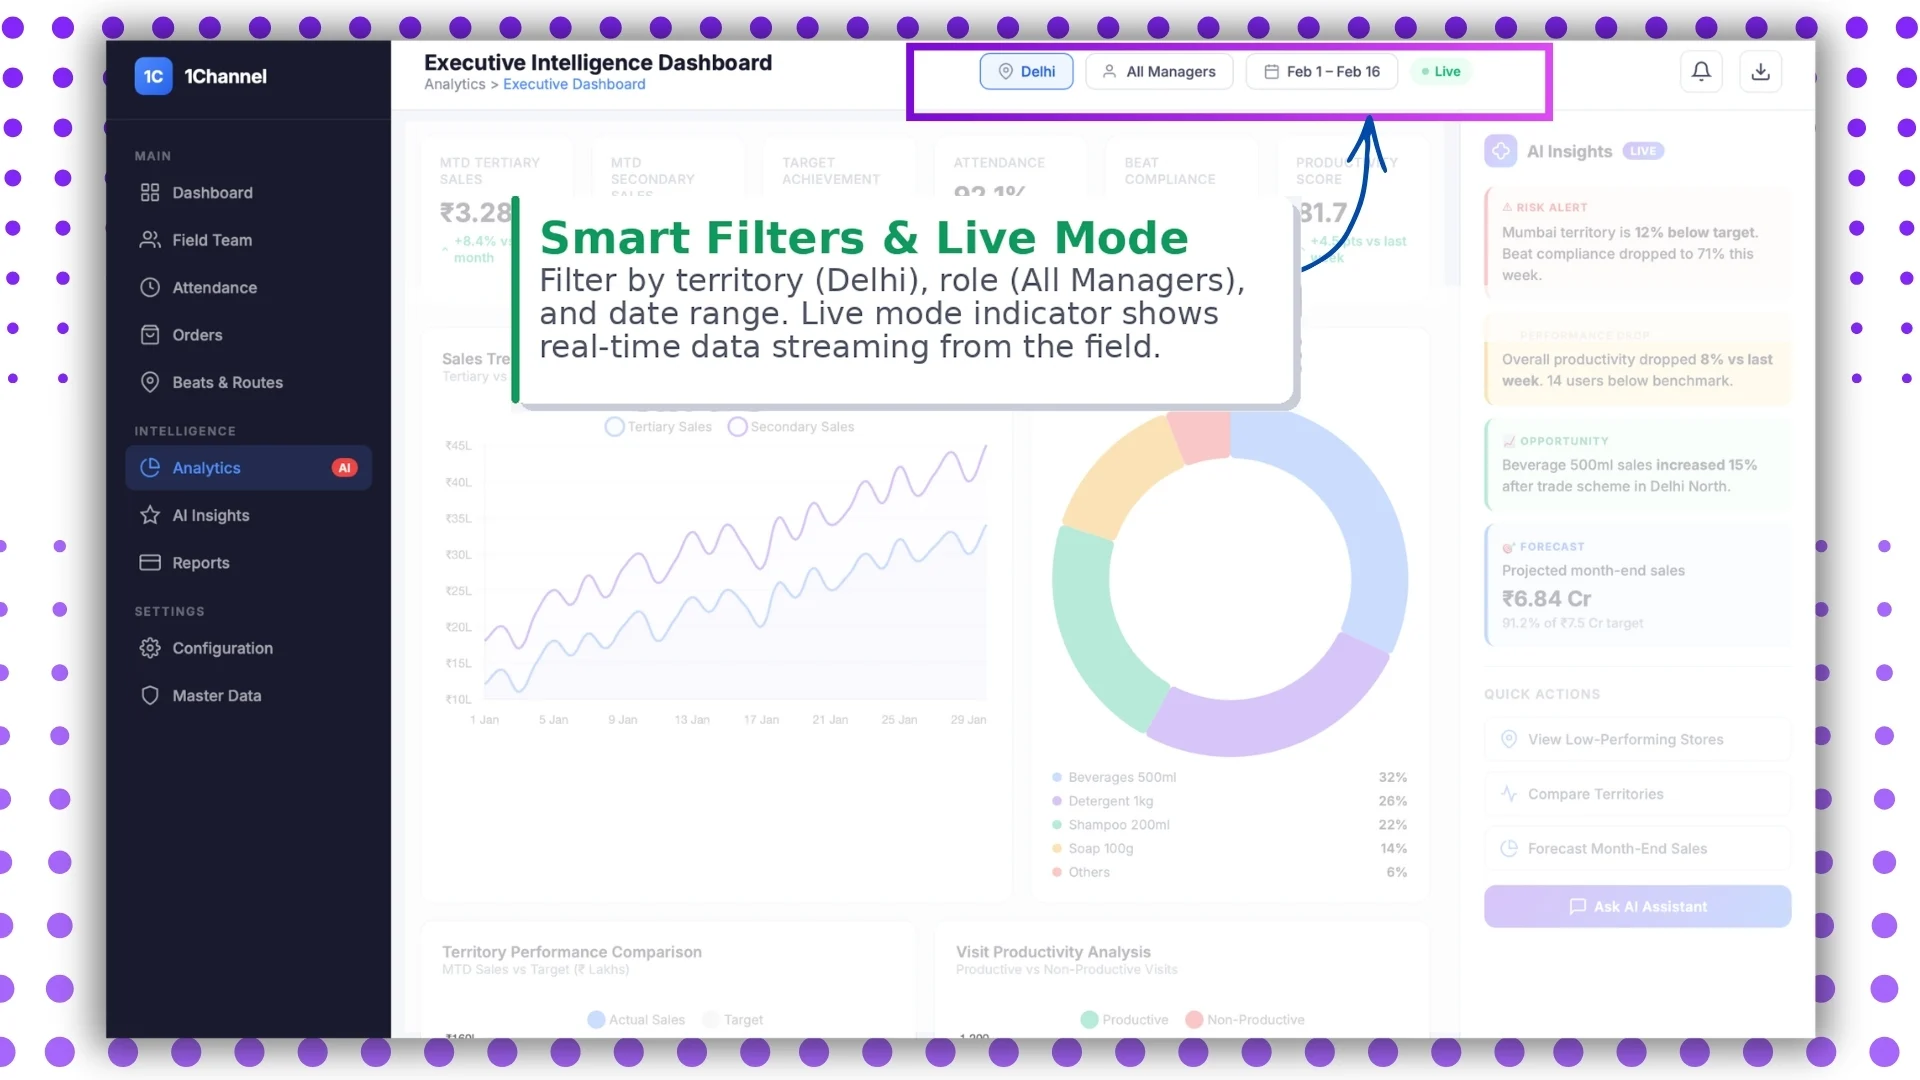
The SFA document strongly emphasizes configurable dashboards and role-based access.
This means users can apply smart filters such as:
- territory
- city
- date range
- role
- manager hierarchy
- store category
This ensures every stakeholder sees only the data relevant to them.
For example:
- BD heads may see territory-wise sales
- managers may see team productivity
- admins may see complete analytics
(Note: Software screens may vary based on your business structure and configured workflows.)
How 1Channel Delivers Real-Time Sales Dashboard Visibility
1Channel SFA helps businesses build fully customizable real-time sales dashboards through its SFA portal and analytics modules.
From attendance compliance and beat tracking to MTD sales reports, territory comparison, and productivity insights, the platform enables businesses to view field performance in one centralized dashboard.
Since every business workflow is different, the dashboard modules, reports, widgets, and filters can be customized as per client requirements and user roles.
Unlock Real-Time Sales Force Automation
1Channel Sales Force Automation provides comprehensive real-time dashboard capabilities with live KPI tracking, attendance monitoring, territory performance comparison, productivity analytics, and customizable reporting to help your sales teams make faster data-driven decisions.
Explore Sales Force Automation →FAQs
What does a real-time sales dashboard show?
It shows live business metrics such as sales performance, attendance, beat compliance, productivity, and territory-wise reporting.
Can the dashboard be customized?
Yes, as per the uploaded SFA document, dashboard elements are customizable according to client requirements.
Who can access the dashboard?
Primarily admins, managers, and authorized reporting heads can access the portal dashboard.
Does it include attendance and visit tracking?
Yes, the dashboard includes attendance reports, visit productivity reports, and compliance analytics.