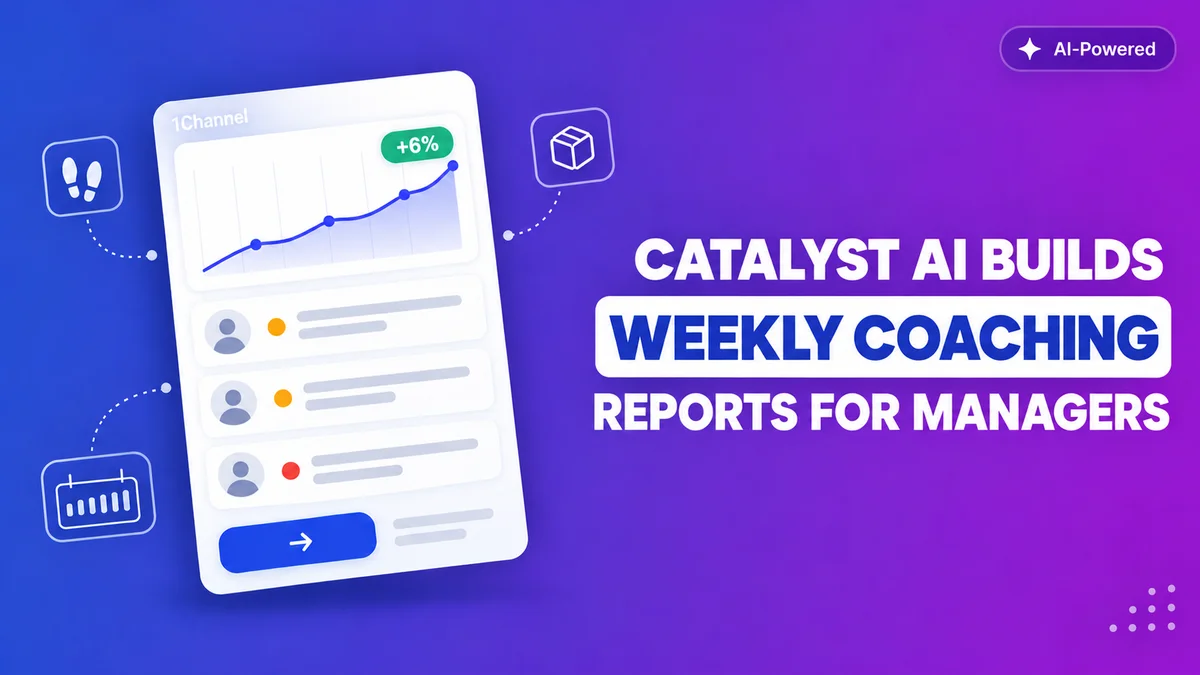
Most sales dashboards hand a manager a wall of numbers and leave the interpreting to them. 1Channel's Catalyst runs a different way: once a week, it reviews every rep's sales, visit, and stock data and turns it into a short, plain-language coaching report a manager can act on the same day.
The report reads like a note from someone who already did the analysis, not another screen to dig through. It names the reps who need a conversation, the stores that need stock moved, and the orders worth a second look, before a manager has opened a single filter.
What Catalyst Reads From the Field
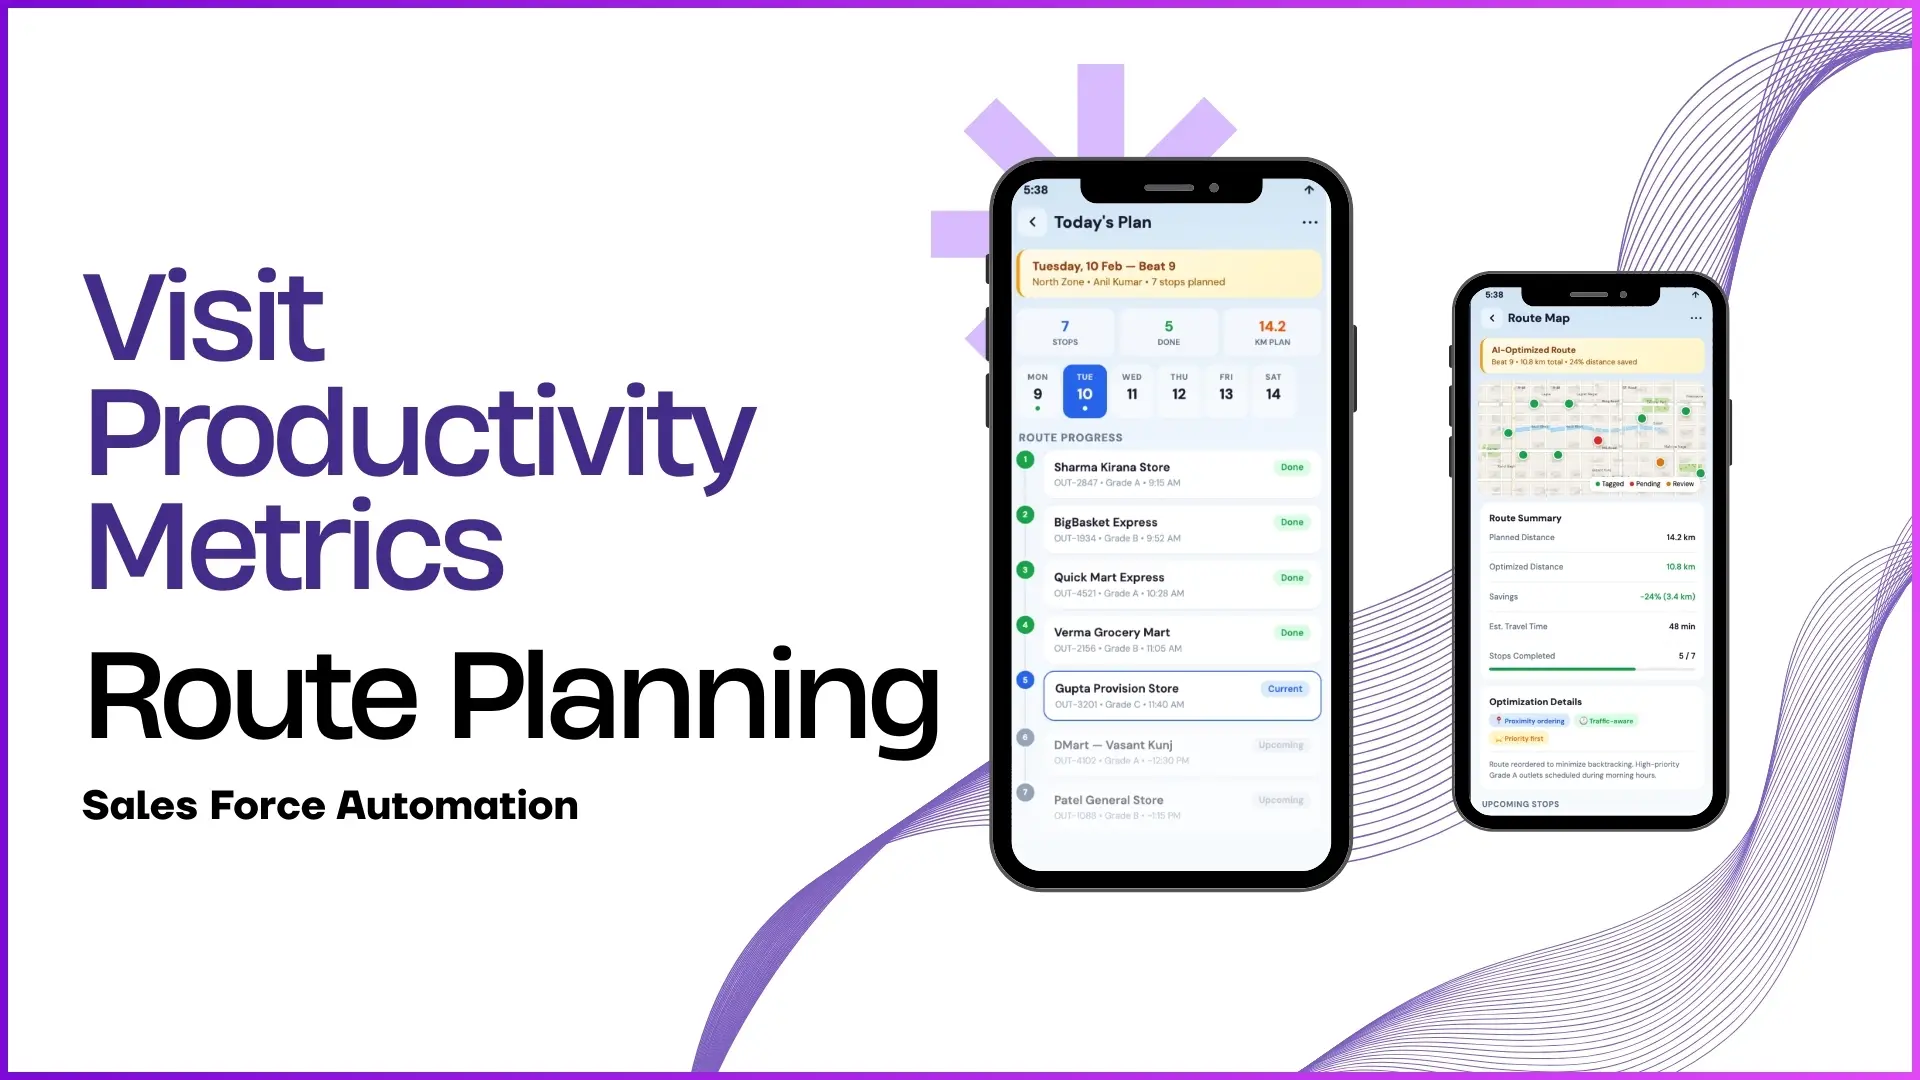
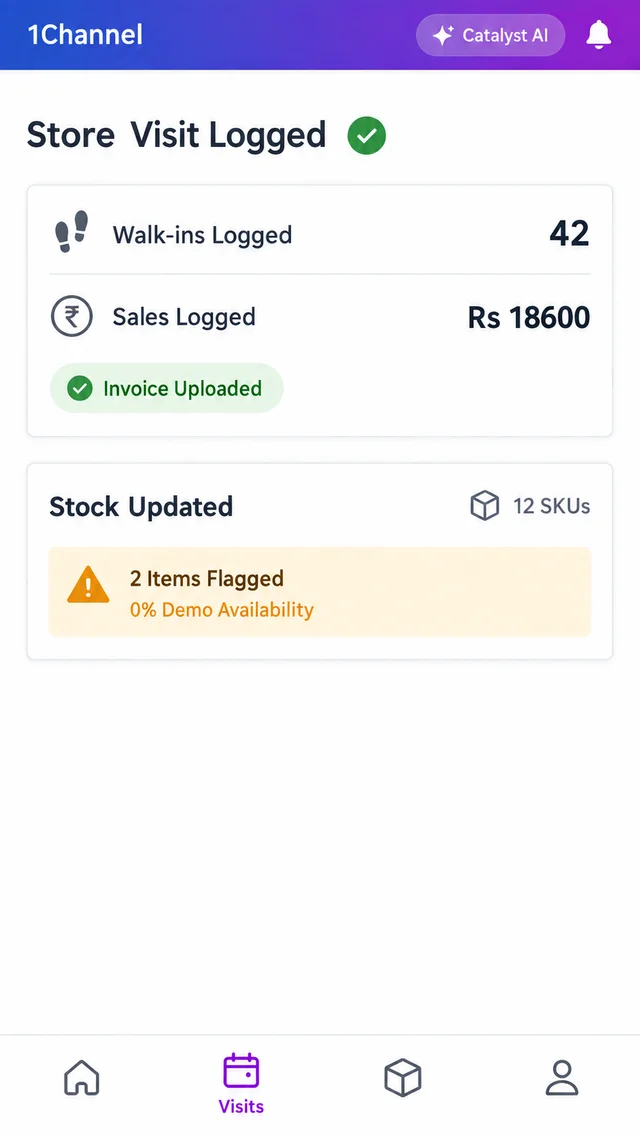
Every walk-in, sale, and stock update a rep logs on the field app becomes an input for Catalyst's predictive model, the same day it happens.
- Captured directly from the field, not a spreadsheet
- Every visit becomes usable data automatically
- Same format across every rep and every store
- Feeds straight into the predictive analytics model
Reps also record stock and demo unit counts at each stop, so a gap that would otherwise go unnoticed, like a product with nothing left to demo, gets caught before it costs a sale.
How the Weekly Report Comes Together
Once a week, Catalyst compares the latest numbers against the last three months of history for each rep and store individually, not against one fixed target everyone is measured on.
That comparison is what separates a genuine trend from an ordinary bad week. A rep who slips for a single day reads differently from a rep whose numbers have been sliding for a month, and the report is built to tell the two apart.
- Runs automatically, no manual report building
- Compares each rep and store to its own history
- Looks at trends across weeks, not single days
- Delivered before the work week starts
What a Manager's Report Actually Contains
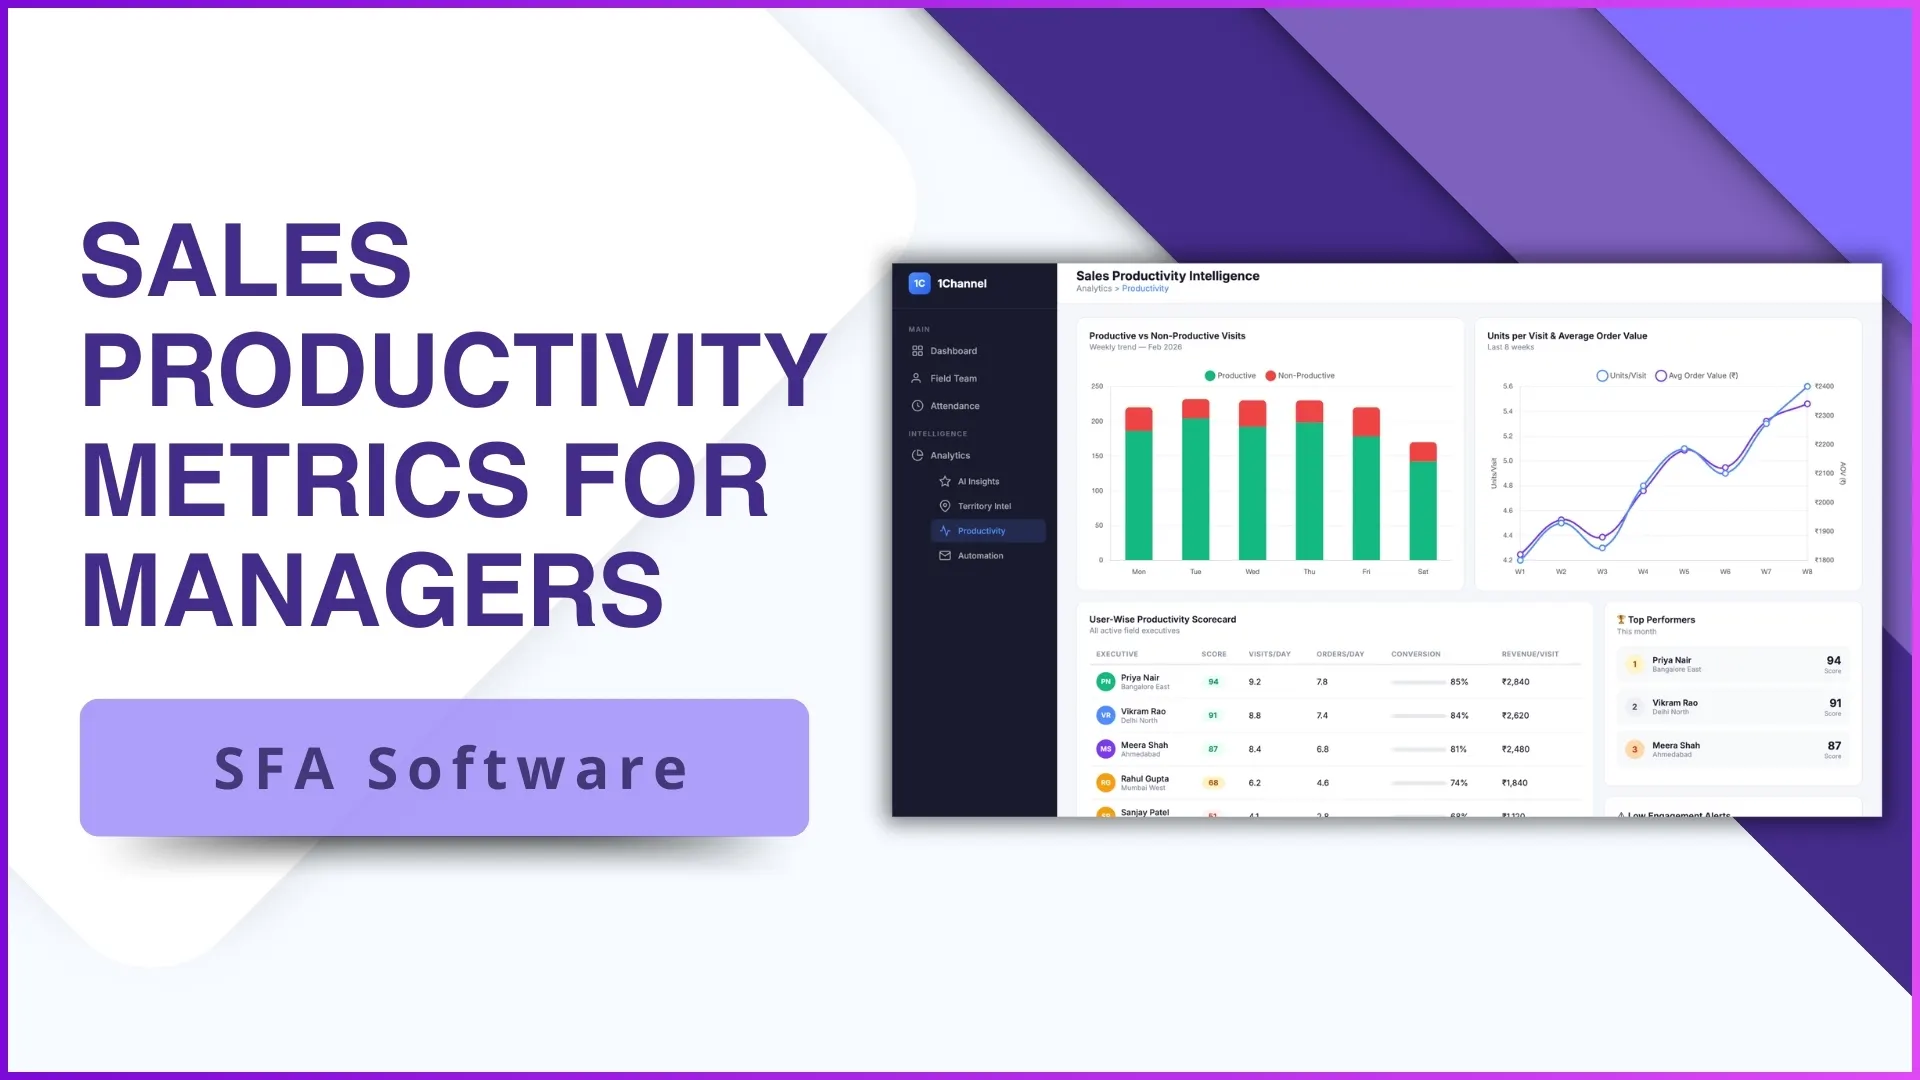
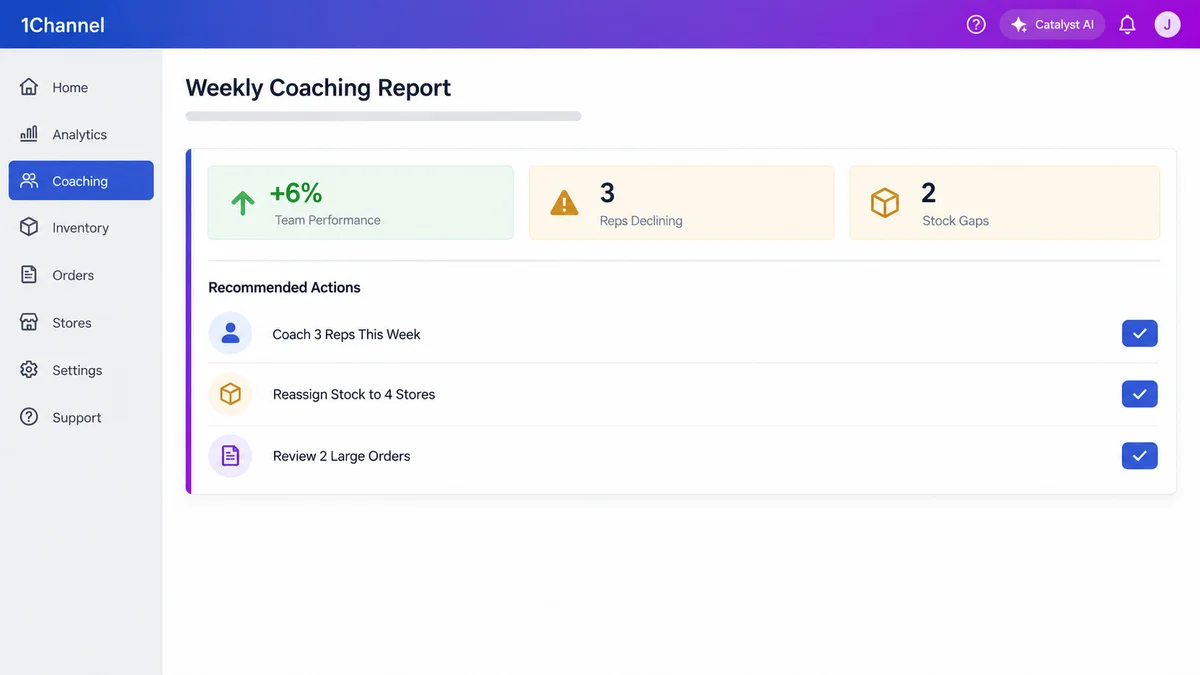
Rather than another dashboard to interpret, the manager gets a short written summary covering what improved, what's at risk, and who needs a conversation this week. In one week's example, the summary read like this:
| Metric | This week |
|---|---|
| Team performance | Up 6% |
| Reps showing a sharp decline | 3 |
| Categories with a stock gap | 2 |
The report closes with named, specific next steps rather than generic advice, so a manager knows exactly where to start:
- Coach 3 reps this week
- Reassign demo stock to 4 low-availability stores
- Review 2 unusually large orders before crediting them as wins
That last point matters as much as the first two. An order that looks unusually large could be a genuine win or a data anomaly, and Catalyst nudges a manager to check before treating it as either.
Built Into the Modules Already in Use
Catalyst is not a bolt-on report. The same predictive engine runs inside every core 1Channel module a team already relies on, from order and stock tracking to loyalty and merchandising.
The same predictive engine also runs inside 1Channel's Sales Force Automation Software in India, so a coaching report builds directly on the beat plans and visit logs reps already fill out, with nothing separate to set up or maintain.
FAQs
1. What does Catalyst's predictive analytics actually predict?
It flags which reps, stores, or categories are heading toward a problem, a sales decline or a stock gap, before it shows up in a month-end review. The model learns each team's normal range from months of field data, so it can separate a real shift from ordinary week-to-week noise.
2. How does Catalyst decide what needs attention first?
By comparing each rep and store against their own recent history rather than one fixed target. A store that quietly drops from a strong run gets flagged the same way as one that misses its target outright, so nothing slips through just because it wasn't the obvious miss.
3. What kind of recommendations does a manager actually get?
Specific, named ones. Instead of a generic "improve performance" alert, the report names the reps who need coaching, the stores that need stock moved, and the orders worth a second look, so a manager knows exactly where to start.
4. Can it tell a real decline apart from one bad week?
Yes. Catalyst looks at trends across months of data rather than any single reporting period, so a rep with one slow week is not flagged the same way as a rep whose numbers have been sliding for a month. That distinction keeps coaching conversations focused on the people who actually need one.
Turn Data Into Action
See how Catalyst turns a week of field sales, visit, and stock data into a coaching report your team can act on today.
Explore Catalyst AI →Note: Software screens may vary based on your business structure and configured workflows.