Managing a field sales team requires more than just tracking sales numbers. Managers need clear visibility into how their teams perform on a daily basis whether employees are marking attendance, visiting markets, completing tasks, and maintaining compliance with defined processes.
Sales productivity metrics help managers evaluate team efficiency, identify gaps, and improve overall field performance.
In a structured sales management environment, these metrics are typically available through dashboards and analytics sections that compile operational data from the field. By reviewing these insights, managers can make informed decisions and guide their teams more effectively.
This article explains the key sales productivity metrics that managers should track and how they can use them with practical examples.
1. Attendance Reporting Percentage
Attendance reporting percentage measures how consistently field employees mark their attendance in the system compared to the total working days in the calendar.
This metric helps managers understand whether employees are regularly logging their work activities.
Example:
If a sales representative has 22 working days in a month but marks attendance on only 18 days, the attendance reporting percentage indicates that the employee missed recording attendance for 4 days. This signals a potential gap in reporting discipline that managers may need to address.
Managers can use this metric to identify employees who frequently miss attendance updates and ensure proper compliance with reporting standards.
Track Sales Performance with Advanced Analytics
1Channel's Sales Analytics Software provides managers with comprehensive dashboards to track attendance, market visits, and field productivity metrics in real-time. Monitor team performance and improve accountability.
Explore Sales Analytics Software →2. Present Reporting Percentage
Present reporting percentage indicates the number of days employees are marked present compared to the number of days they have reported attendance.
This metric provides clarity on actual work presence within the reporting structure.
Example:
A salesperson reports attendance on 20 days but is marked present for 17 days. The present reporting percentage reflects how many of those reported days were actual working days, helping managers monitor employee engagement and availability in the field.
Managers can analyse this metric to determine whether employees are consistently active or if there are gaps in their working days.
3. Late Attendance Percentage
Late attendance percentage tracks how frequently employees report attendance later than the expected reporting time.
This metric highlights punctuality and discipline among field teams.
Example:
If a sales executive reports attendance late on 6 out of 20 working days, the late attendance percentage indicates a pattern of delayed reporting. This may impact market coverage and productivity.
Managers can use this information to encourage better time management and ensure field activities begin on schedule.
4. Market Visit Percentage
Market visit percentage measures how frequently sales employees visit assigned markets or stores compared to planned working days.
This metric is critical because sales productivity in field operations is closely tied to market engagement.
Example:
If a salesperson is scheduled to visit markets on 20 days but actually completes visits on only 14 days, the market visit percentage reflects reduced field activity. Managers can then investigate whether the issue is due to planning, workload, or execution challenges.
By monitoring market visits, managers can ensure that teams maintain strong relationships with retailers and maximize sales opportunities.
5. Attendance Missed Days
Attendance missed days represent the total number of days when an employee did not report attendance at all.
This metric helps managers identify irregular reporting behaviour.
Example:
A sales representative with 22 working days in a month may have 5 missed attendance days. This suggests that the employee either did not log attendance or did not work on those days without proper reporting.
Managers can use this insight to enforce accountability and ensure consistent reporting practices across the team.
6. Defaulted Days
Defaulted days indicate instances where employees failed to complete required reporting tasks or attendance activities within the system.
These days often highlight compliance gaps in daily operational processes.
Example:
If a field employee fails to record attendance, update activities, or complete required entries for a particular day, that day may be marked as a defaulted day. If this happens repeatedly, managers can identify it through the defaulted days metric.
Tracking this metric allows managers to detect recurring issues and take corrective action.
7. Calendar vs Attendance Comparison
A calendar versus attendance comparison provides a detailed view of working days against reported attendance.
This helps managers quickly identify discrepancies between planned workdays and actual reporting.
Example:
A monthly calendar shows 26 possible working days, but an employee records attendance on only 21 days. This comparison highlights the difference and helps managers investigate the reason behind missing days.
Such comparisons provide a quick overview of productivity gaps within the team.
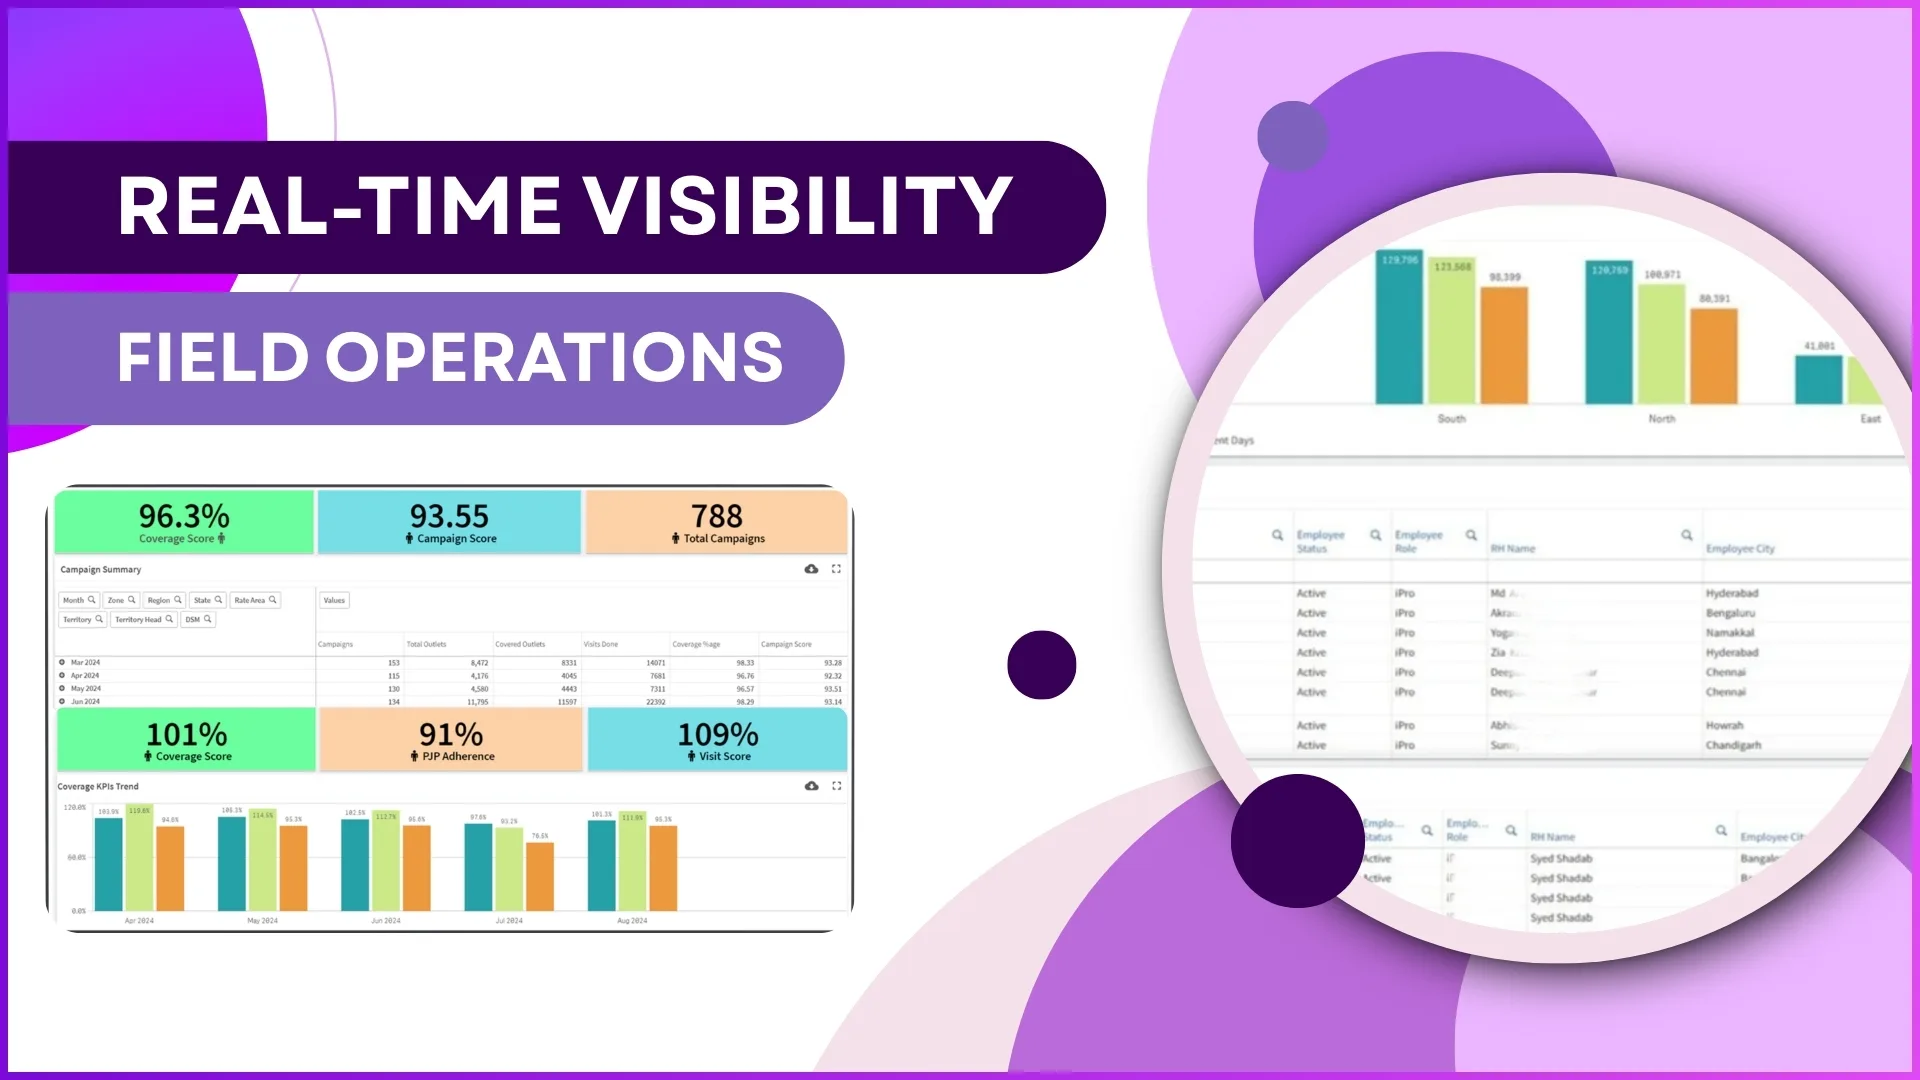
8. Employee Attendance Compliance Reports
Attendance compliance reports consolidate multiple metrics such as attendance reporting, present days, missed days, and late attendance into a detailed report.
These reports typically include filters such as:
- Employee code
- Employee name
- Employee role
- Employee status
- Employee city
- Calendar days
- Attendance reporting days
- Present days
- Missed attendance days
Example:
A manager reviewing compliance reports may notice that employees in a specific city consistently have higher late attendance percentages. This insight allows the manager to investigate regional challenges or adjust scheduling practices.
Such detailed reporting enables data-driven decision-making.
How Sales Productivity Metrics Help Managers
Tracking productivity metrics helps managers achieve several operational benefits:
Improved team accountability
Managers can identify employees who consistently follow reporting processes and those who require guidance.
Better performance evaluation
Metrics provide objective data to evaluate employee productivity and discipline.
Faster issue detection
Managers can quickly identify patterns such as missed attendance, reduced market visits, or frequent late reporting.
More informed planning
With clear visibility into field activity, managers can refine schedules, allocate resources, and improve market coverage.
How 1Channel SFA Helps Managers Track Sales Productivity
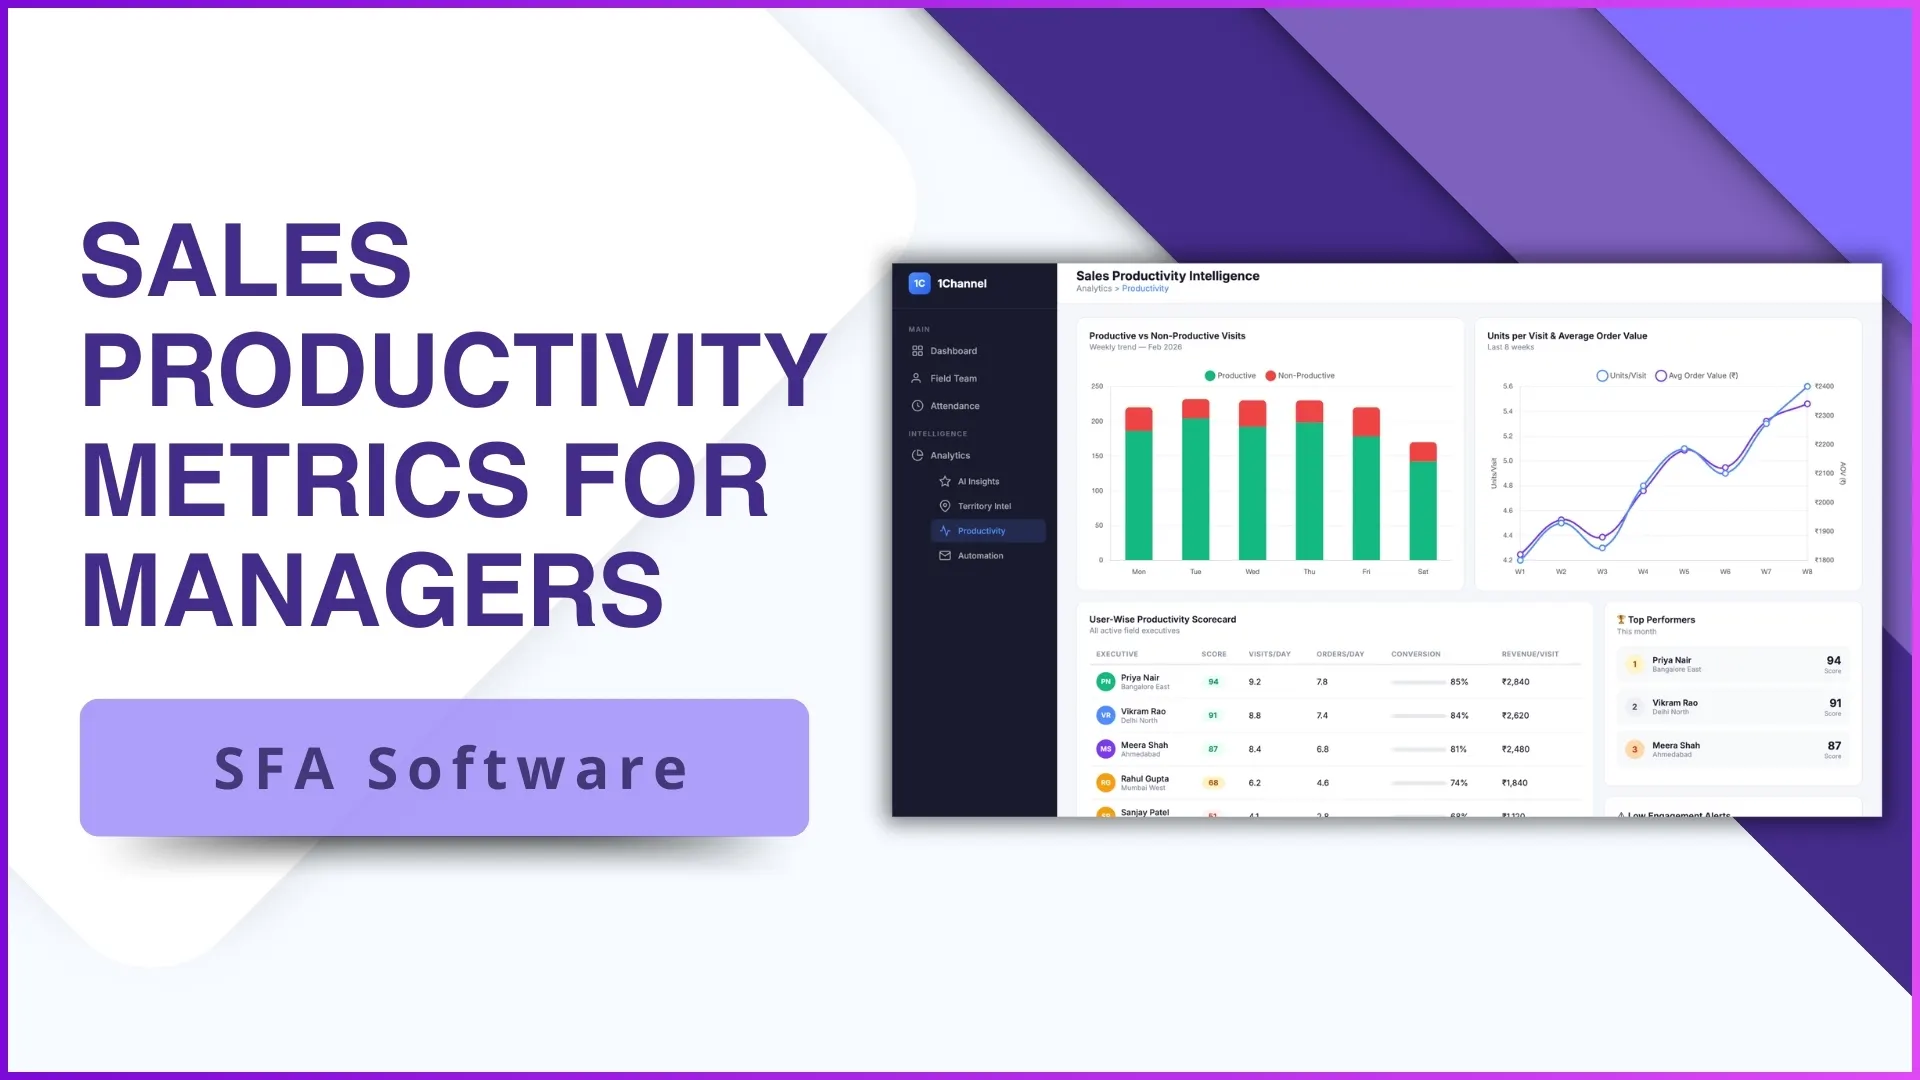
Sales productivity metrics become far more useful when they are presented through a centralized dashboard and analytics system.
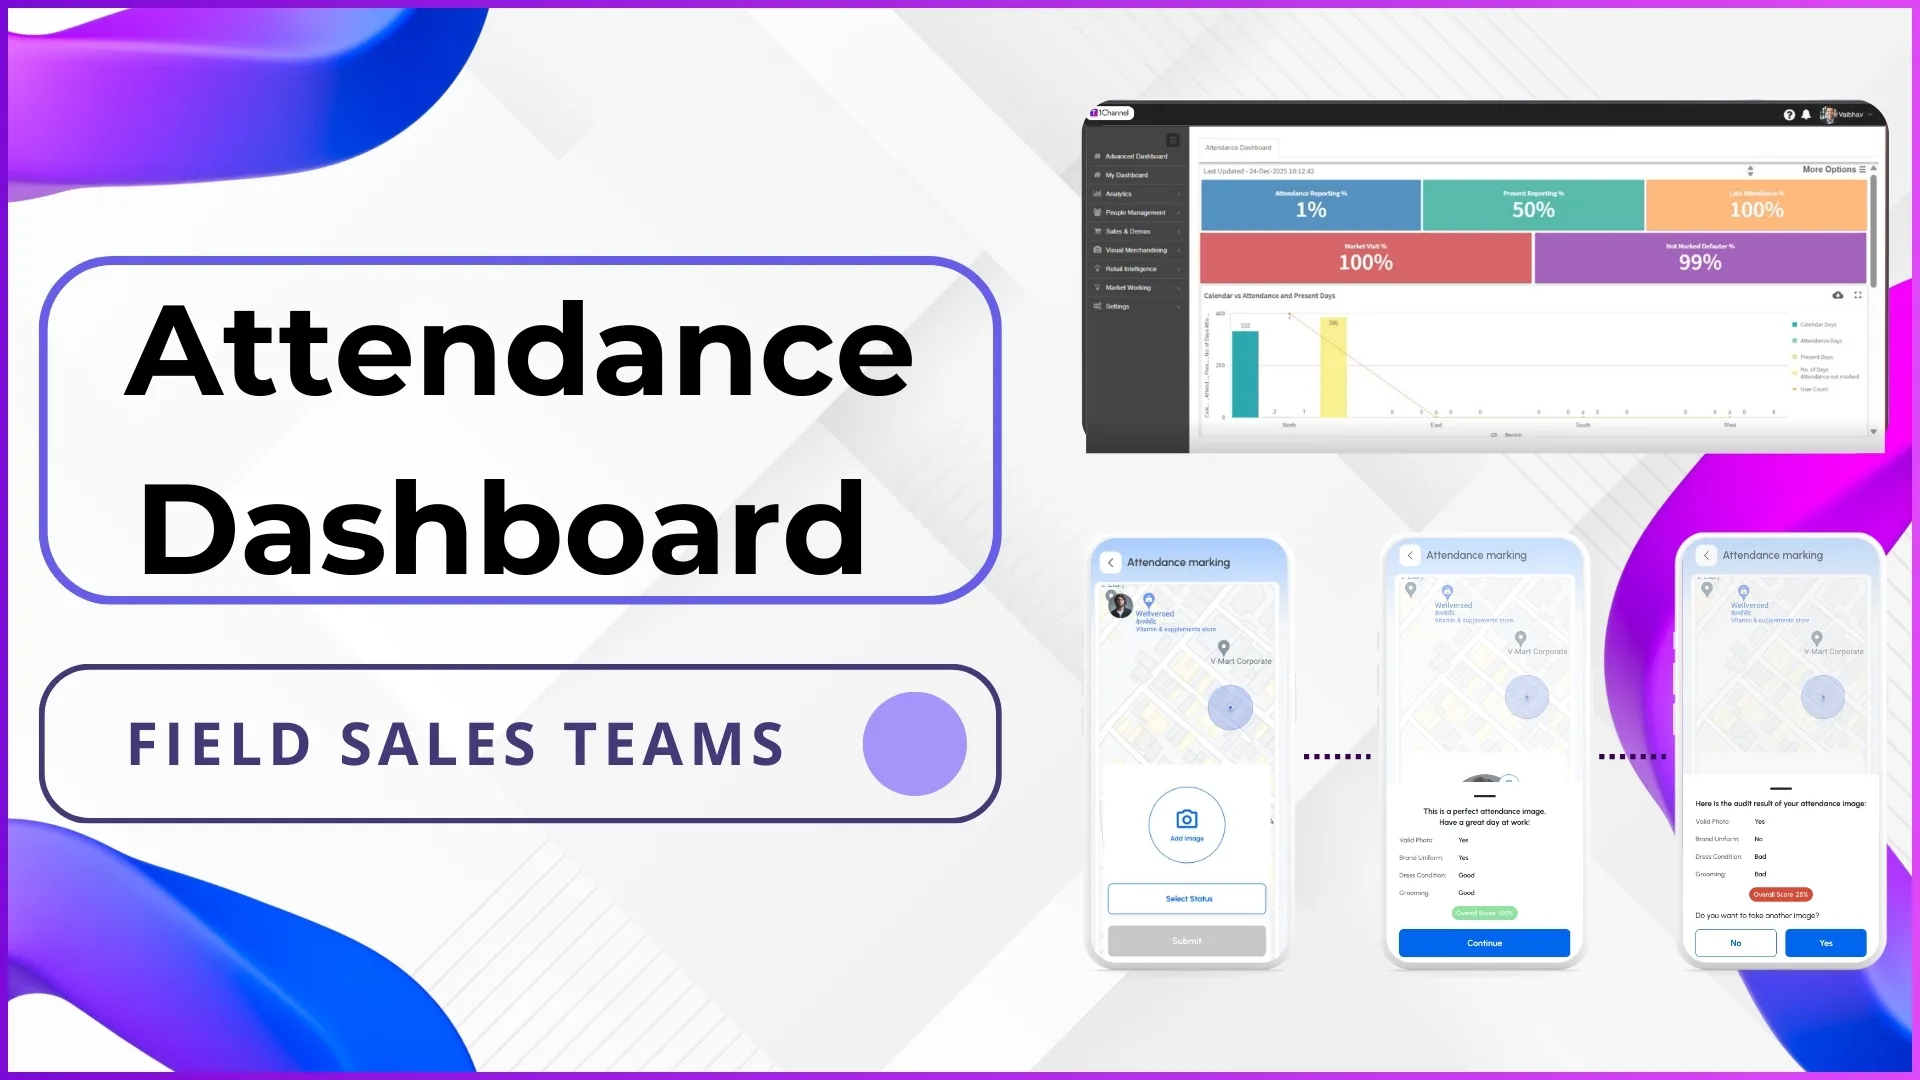
1Channel SFA provides managers with an advanced dashboard that displays key productivity indicators such as attendance reporting percentage, present reporting percentage, late attendance percentage, market visit percentage, and detailed attendance compliance reports.
Managers can view structured data that compares calendar days with attendance records, identify missed reporting days, and monitor overall employee compliance.
The platform also allows customized dashboards and reports so businesses can configure metrics according to their operational requirements.
With this level of visibility, managers can monitor field activities more efficiently and ensure that their teams maintain consistent productivity.
Conclusion
Sales productivity metrics give managers a clear picture of how their field teams operate on a daily basis. By tracking indicators such as attendance reporting percentage, market visit percentage, late attendance, missed days, and compliance reports, managers can identify performance gaps and improve operational discipline.
When these metrics are consolidated through dashboards and analytics tools, managers gain actionable insights that help them guide teams, improve accountability, and strengthen overall sales performance