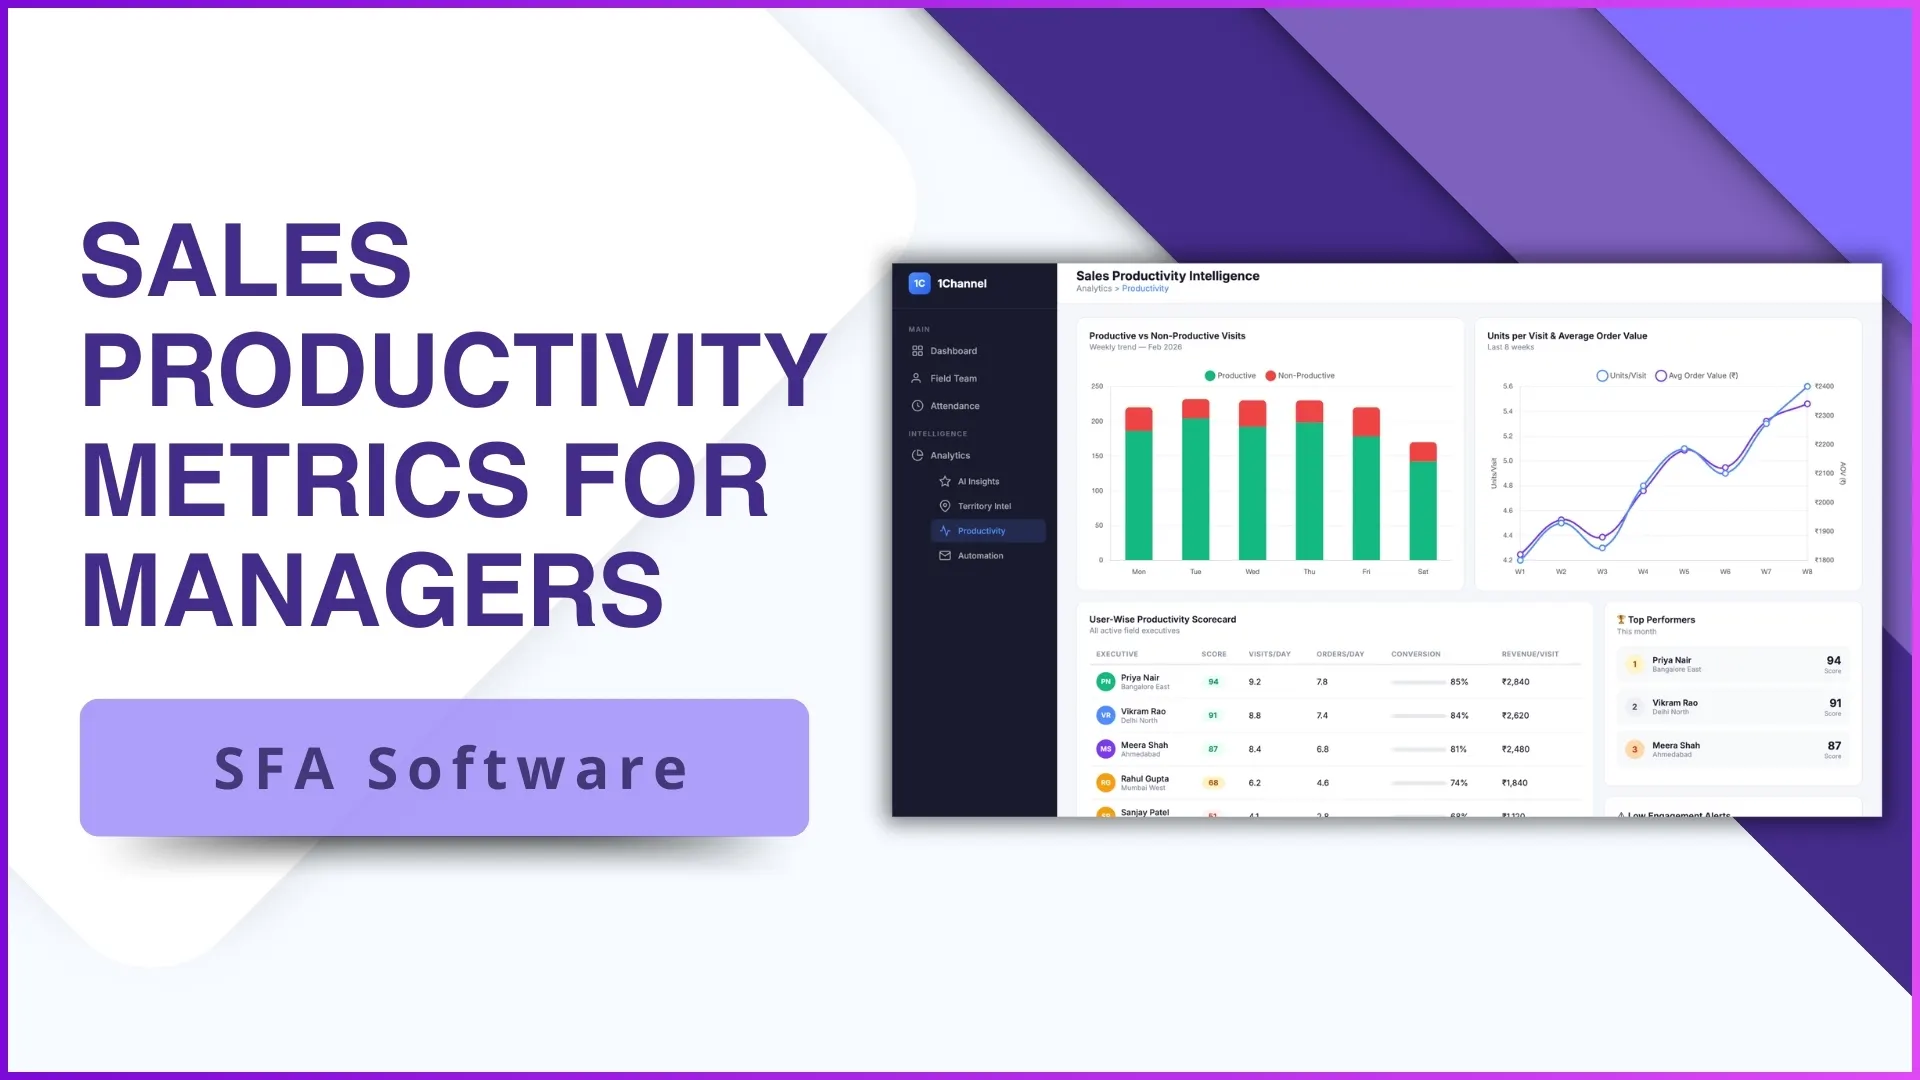
Reporting percentage, present days, late arrivals, defaulter list, location verification, payroll match. The leadership attendance summary carries six families of signal.
None of them alone tells the full story. The rep who is present every day but logs every attendance an hour late is a different problem than the one who skips Mondays.
The report's job is to surface those patterns at the leadership view. Not the raw timeline, not the rep-by-rep ledger. The summary that points to where discipline is breaking.
Table of Contents
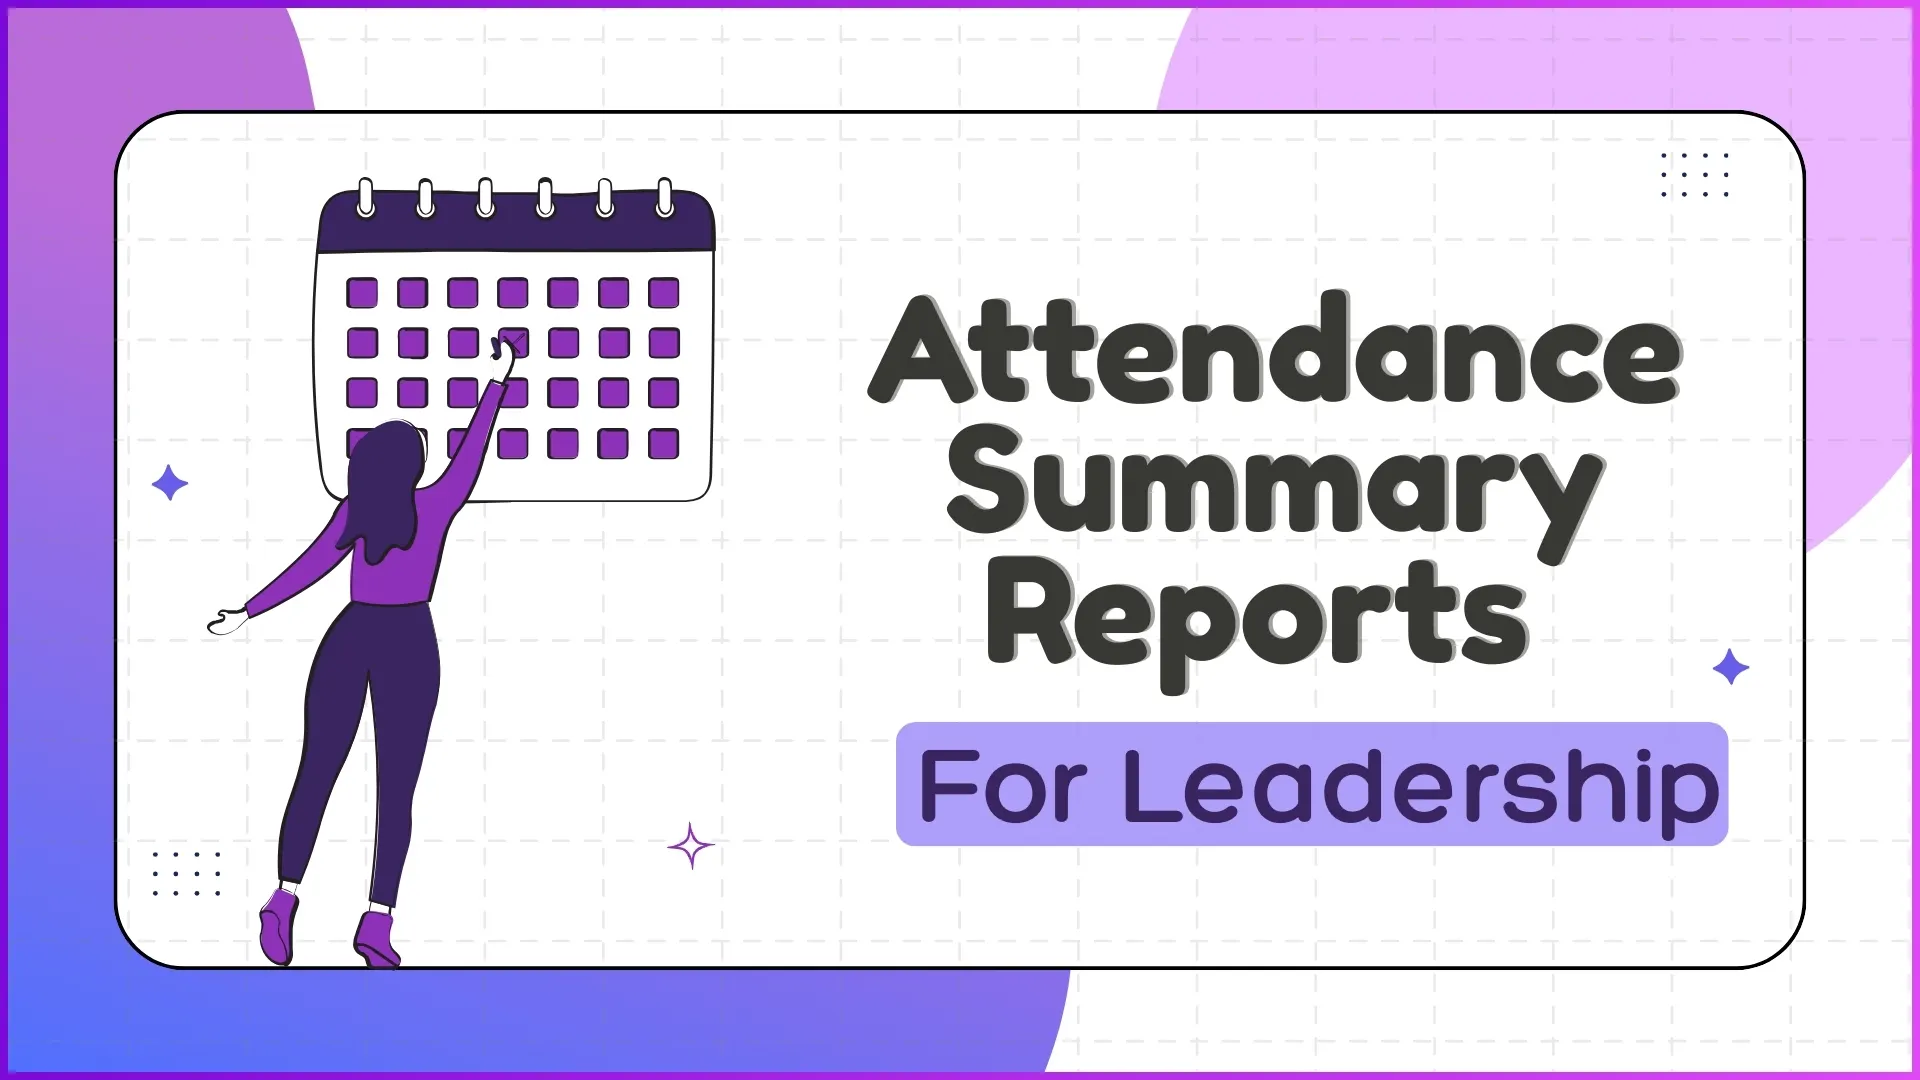
What Leadership Actually Reads When the Attendance Report Lands
Frontline managers read attendance day by day to schedule and coach. Leadership reads the same data at a different cadence and for a different decision.
The leadership view answers four questions. Is the workforce showing up? Where are the cracks? Which patterns are getting worse? What needs an intervention now versus what can wait?
Five Sections Every Leadership-Grade Attendance Summary Contains
A leadership-grade summary clusters the data into five sections. Each section answers a different question:
1. Reporting Percentage and Compliance
What share of the workforce filed attendance on time, across the period. The first signal of program health and the easiest one to misread without context.
2. Present-Day Trend
Present-day count week over week, with comparison to the prior period. Tells the story of whether discipline is climbing or sliding, not just where it stands today.
3. Late Attendance Heatmap
Late arrivals broken down by region, by week, and by team. The map shows whether lateness is a local pattern or a system-wide drift.
4. Defaulter and Exception List
Reps with three or more consecutive defaults, missed reports, or unexplained absences. The named list the leadership team escalates from in the weekly review.
5. Location and Photo Verification Summary
Roll-up of how many attendance entries cleared the geofencing and photo-validation checks, and how many were flagged for review.
How 1Channel Builds Attendance Summaries for Malaysian Leadership
1Channel runs leadership attendance summaries through its cloud Sales Force Automation and analytics modules. Every check-in event posts to the same ledger that powers the five sections above.
1Channel's AI engine watches the underlying patterns and surfaces the ones that need leadership's attention. A region whose late-attendance number has been climbing for three weeks gets flagged before it reaches the monthly review.
Configuration runs through the admin console. Leadership defines its thresholds, its segments, and its escalation rules. The platform recomputes the dashboard automatically against every new event, and the automated alerts hit the inbox only when a threshold is breached.
Explore Cloud Sales Analytics Software
1Channel's cloud sales analytics platform turns attendance events into leadership-grade summaries with AI pattern detection and automated escalation alerts.
Explore Sales Analytics Software →Action Checklist for Rolling Out a Leadership Attendance Report
A clean sequence to put the right attendance summary in front of leadership:
- Pick the five sections first, not the individual metrics. Leadership reads patterns, not data points. The sections anchor the conversation; the metrics under them stay configurable.
- Set the cadence above the manager's cadence. Daily for managers, weekly for leadership. Monthly is too late to act; weekly catches the slide while there is still room to course-correct.
- Wire geofencing and photo verification into the same dashboard. Verification is the difference between attendance discipline and check-in theatre.
- Build the defaulter list with an action lane. Every name on the list should pair with an owner and a next step. A list without action becomes wallpaper.
- Make the trend lines as prominent as the absolute numbers. A 95 percent present-day percentage looks great until the trend shows it falling two points a quarter.
- Recalibrate thresholds every quarter. The threshold that flags a healthy team in Q1 may miss a slipping team by Q4. The cloud platform's analytics layer should support that without engineering work.