Sales to date, divided by the days gone, multiplied by the days in the period.
That one line tells a sales manager whether a Ramadan target will land while there is still time to act.
Across Saudi Arabia, FMCG teams carry some of their biggest monthly targets into Ramadan. This guide builds that daily pace check in a free web spreadsheet, step by step.
After the walkthrough come two days of real figures, the limits of a manual sheet, and how 1Channel tracks the same numbers without retyping.
The method suits FMCG, Consumer Durables, Cosmetics & Personal Care and Pharma field teams that sell against a fixed seasonal target.

Why Ramadan Targets Need a Daily Pace Check
Ramadan is one of the two seasonal demand windows Saudi FMCG distributors plan around, along with Hajj. Targets for the month are set high, and the window is short.
A month-end report only says who missed. A daily run rate says who is drifting while two or three weeks are still left to recover.
The question each morning is simple: if every rep keeps selling at today's pace, where does each one finish?
What You Need Before You Start
- A web browser. EtherCalc runs at ethercalc.net with no sign-up and no install.
- The number of days your Ramadan target covers, for example 30.
- Each rep's target for the period in SAR.
- A daily sales-to-date figure per rep, taken from your order or distributor report.
Step by Step: Build the Tracker in EtherCalc
Step 1: Create a New Spreadsheet
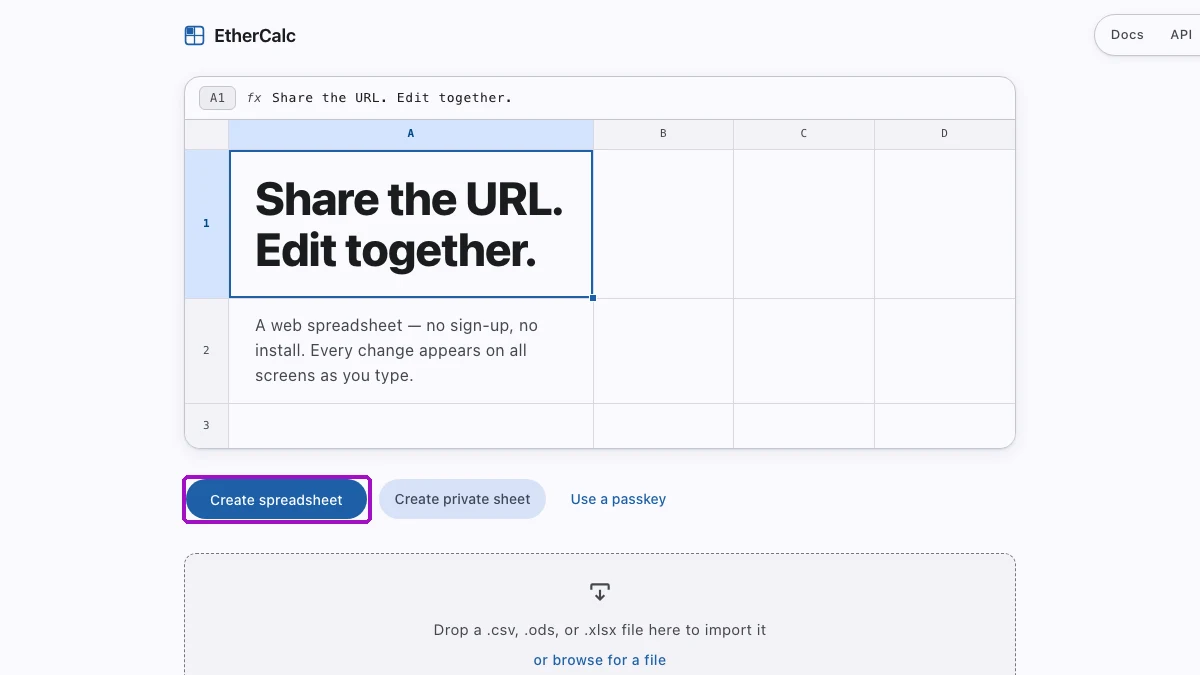
Open ethercalc.net and click Create spreadsheet. A blank grid opens at a new web address, and that address is the sheet.
Step 2: Add the Headers and Period Settings
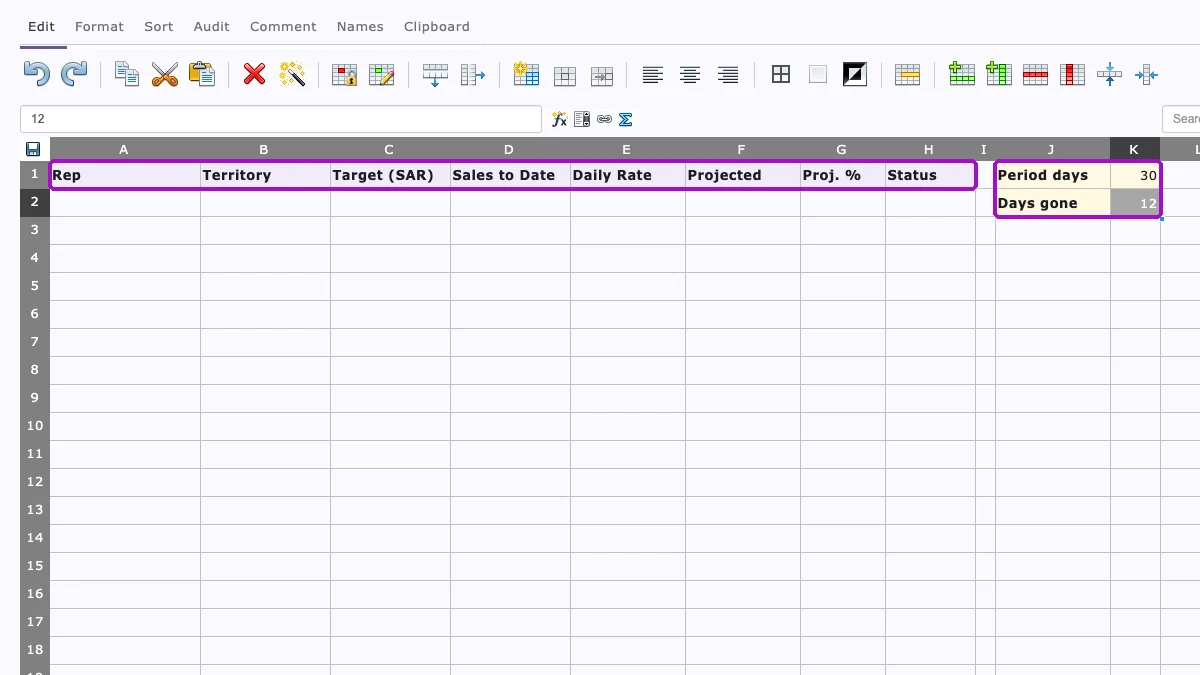
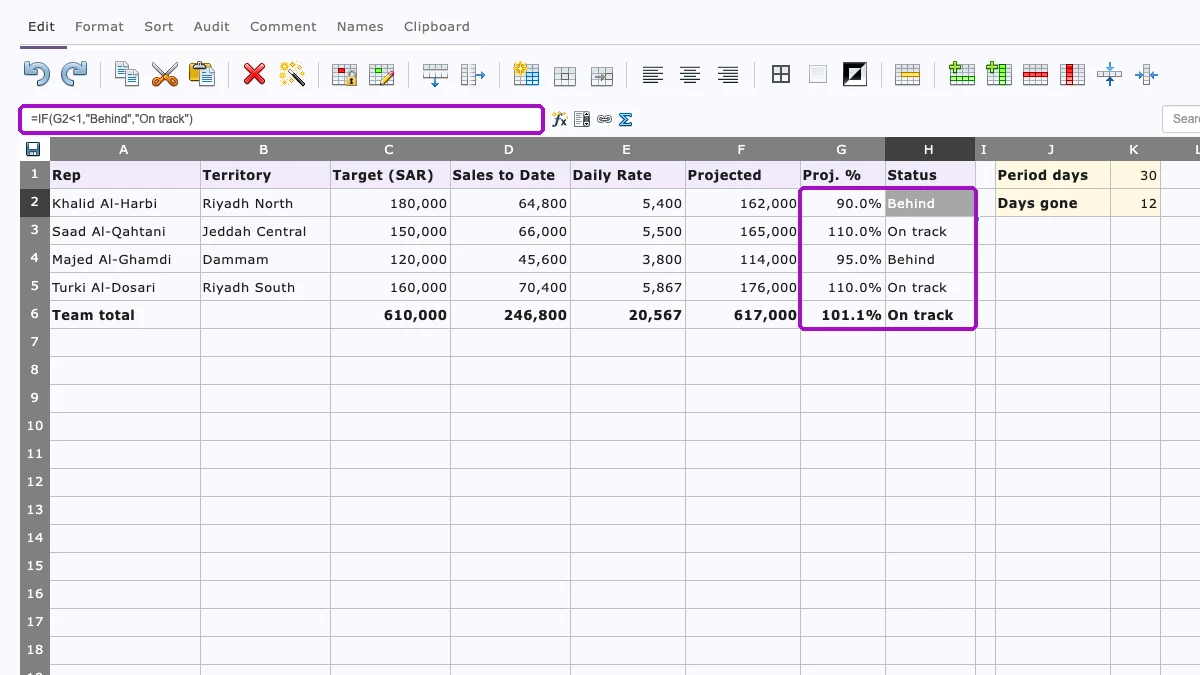
In row 1, type eight headers: Rep, Territory, Target (SAR), Sales to Date, Daily Rate, Projected, Proj. % and Status.
Off to the side, put the two numbers every formula will share: Period days in K1 (30) and Days gone in K2 (12 on the twelfth day).
Step 3: Enter Each Rep's Target and Sales to Date
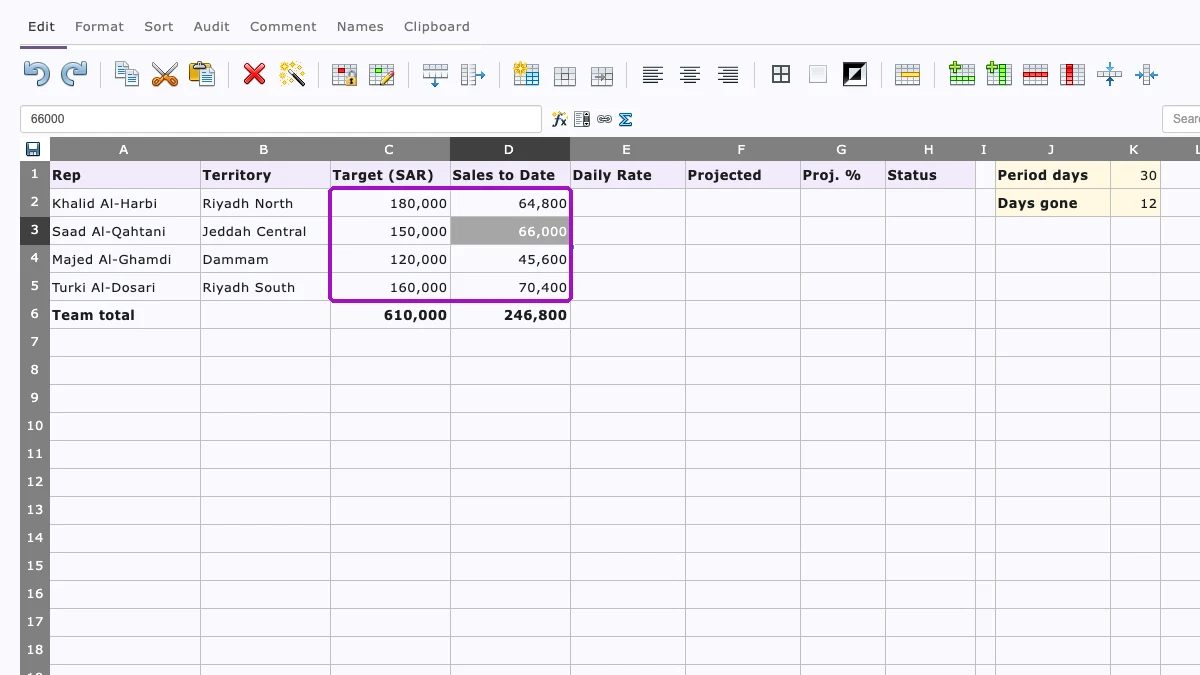
Add one row per rep with their territory, Ramadan target and sales to date. Four reps across Riyadh, Jeddah and Dammam are used here.
In row 6, a Team total line uses SUM to add up the target and sales columns.
Step 4: Add the Run Rate and Projected Finish
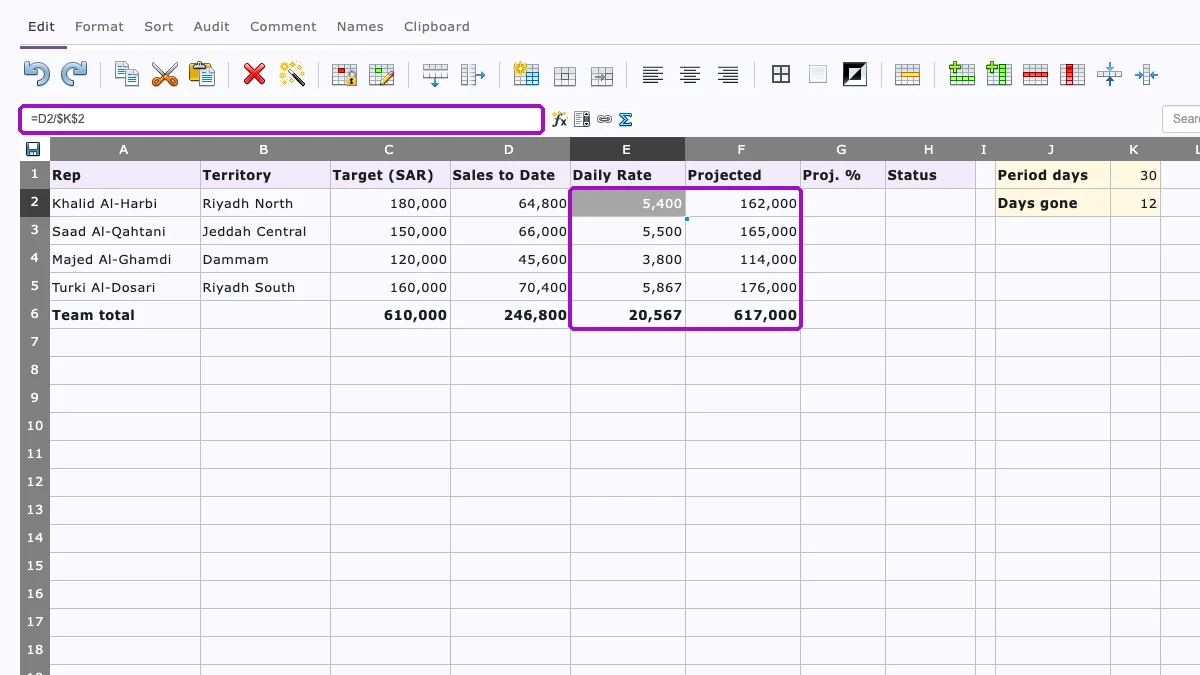
In E2, type =D2/$K$2. This is the average sales per day so far. The dollar signs keep the formula pointing at Days gone when you copy it down.
In F2, type =E2*$K$1. This projects the finish if the rep keeps the same daily pace. Copy both formulas down to row 6.
Step 5: Flag Who Is Behind
In G2, type =F2/C2 and format it as a percentage. This is the projected finish as a share of target.
In H2, type =IF(G2<1,"Behind","On track") so anyone projected below 100% is labelled. Copy both down.
Step 6: Update the Sheet Every Morning
Each morning, raise Days gone by one and overwrite every rep's sales to date. The formulas recalculate on their own.
Share the sheet's web address with the area managers who need to see it.
What the Sheet Showed on Days 12 and 13
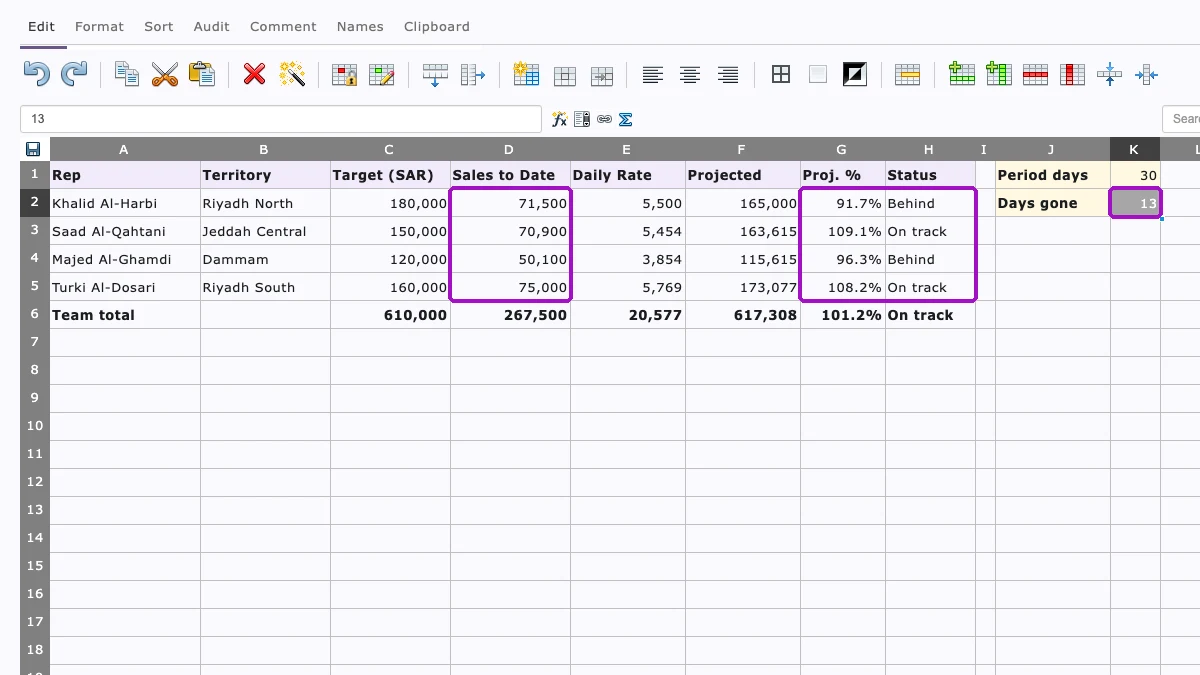
On day 12 the team was projected at 101.1% of its SAR 610,000 target. The total said on track, yet two of the four reps were not.
| Rep | Target (SAR) | Projected, Day 12 | Projected, Day 13 | Status |
|---|---|---|---|---|
| Khalid Al-Harbi, Riyadh North | 180,000 | 162,000 (90.0%) | 165,000 (91.7%) | Behind |
| Saad Al-Qahtani, Jeddah Central | 150,000 | 165,000 (110.0%) | 163,615 (109.1%) | On track |
| Majed Al-Ghamdi, Dammam | 120,000 | 114,000 (95.0%) | 115,615 (96.3%) | Behind |
| Turki Al-Dosari, Riyadh South | 160,000 | 176,000 (110.0%) | 173,077 (108.2%) | On track |
| Team total | 610,000 | 617,000 (101.1%) | 617,308 (101.2%) | On track |
Khalid sold SAR 6,700 on day 13, above his average, so his projection rose.
He is still behind, and the sheet shows it with 17 days left to close the gap.
Saad and Turki dipped slightly. Both stay above target, so a manager can spend the morning on Riyadh North and Dammam instead.
Where the Manual Sheet Falls Short
- Someone retypes it daily. Every rep's sales to date is keyed by hand, so the sheet is only as current as the last person who updated it.
- The link is the only lock. A standard EtherCalc sheet can be edited by anyone who has its address.
- Yesterday disappears. Overwriting sales to date keeps no daily history, so there is no trend line unless you copy the tab.
- It assumes an even month. A straight run rate treats every remaining day like the days so far, and Ramadan demand rarely moves in a straight line.
- Reps cannot see their own pace. The sheet sits with the manager, not on the phone of the person who has to act on it.
- One row per rep only. Tracking by store or by unit as well as by value means more tabs and more typing.
How 1Channel Tracks Ramadan Targets Without Retyping
1Channel sets targets by person or by store, in value, units or counts, and for individuals or whole teams. Achievement is tracked live from the sales recorded in the platform.
Run rate and projected finish are calculated for you, with a month-on-month trend. Managers see the people behind target among their daily priorities, without opening a spreadsheet.
The target vs achievement report breaks figures down by person, store or manager, with Excel export and scheduled emails.
Managers can also ask plain-language questions on dashboards, with answers checked against the data.
| Need | Manual Sheet | 1Channel |
|---|---|---|
| Sales to date | Retyped every morning | Tracked live |
| Run rate and projected finish | Your own formulas | Built in |
| Who is behind | An IF formula on one tab | Shown to each manager daily |
| Trend over time | Lost when overwritten | Month-on-month trend |
| Who can see it | Anyone with the link | Each manager's own reporting line |
See Every Rep's Ramadan Pace Before It Slips
Track targets, run rate and projected finish for field teams across the Kingdom, without a daily spreadsheet.
Explore Sales Analytics Software →Common Mistakes to Avoid
- Reading only the team total. A total above 100% can hide reps who are well behind, as day 12 showed.
- Forgetting to move Days gone. If K2 stays at 12 while sales keep rising, every projection is overstated.
- Dropping the dollar signs. Without $K$2 and $K$1, copied formulas point at empty cells and return errors.
- Treating the projection as a forecast. It is a pace check, so read it alongside what you know about the weeks ahead.
- Mixing gross and net sales. Use the same sales definition every morning, or the run rate jumps for no real reason.
Note: Since the manual method was only tested once, consult a technical expert before running bulk operations.