Most FMCG brands in India judge an outlet by one number: what it bought this month. That number hides more than it shows.
A store can hit its volume while a focus brand sits unsold and the shelf looks nothing like the plan. An outlet scorecard puts all of it into one weighted score, so every store is judged the same way.
The approach works for beverages, spirits and personal care as much as for packaged food. Here is how to build one.

1. Choose the KPIs That Describe a Good Outlet
Start with the few things that make an outlet good for your brand. A scorecard can take any mix of KPIs.
One brand's set, for example, is volume, market share, distribution of focus brands (POD) and in-store execution. Yours may differ.
Keep the list short. A rep can act on four or five KPIs, but not on twelve.
2. Give Each KPI a Weight
Not every KPI matters equally. Weights decide how much each one counts towards the outlet's overall score.
On the outlet scorecard, each KPI card shows its weight, how many sub-parameters sit under it and the percentage achieved for the month to date.
| KPI | Example weight | What it measures |
|---|---|---|
| Volume | 55% | Cases sold against target, split by brand groups |
| Market Share | 10% | The brand's share against competitors |
| POD | 20% | How many focus brands the outlet bought this month |
| Execution | 15% | In-store standards, scored on each visit |
These weights come from one deployment. Each brand sets its own.
3. Break Volume Into Sub-Parameters
Total volume can hide a weak focus brand. Splitting it shows where the cases came from.
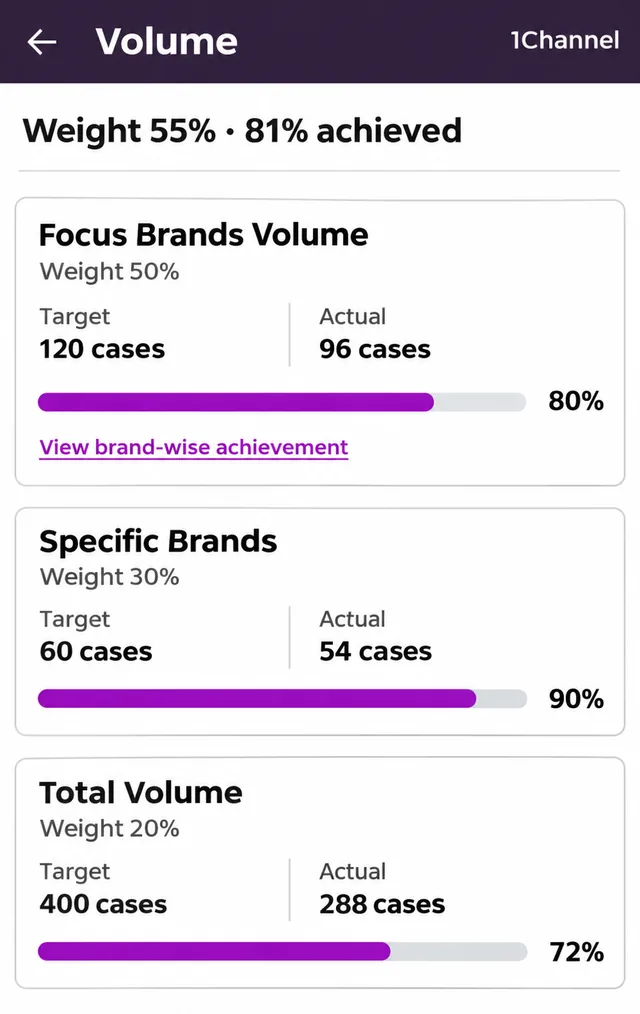
Volume can carry its own sub-parameters, such as focus brands, specific brands and total volume. Each has a weight, target and actual in cases and a progress bar, with a brand-by-brand view underneath.
Score Every Outlet the Same Way
1Channel's SFA shows each outlet's weighted scorecard on the rep's phone, with volume, distribution, market share and execution side by side and the rules written on each card.
Explore 1Channel's Sales Force Automation →4. Write the Counting Rules Down
A score only works if everyone counts the same way. Put the rules on the scorecard itself.
For POD, a focus brand counts once the outlet buys it in the month, and every focus brand counts equally. Market share shows a dash until competitor sales data for the month is uploaded, rather than a guessed number.
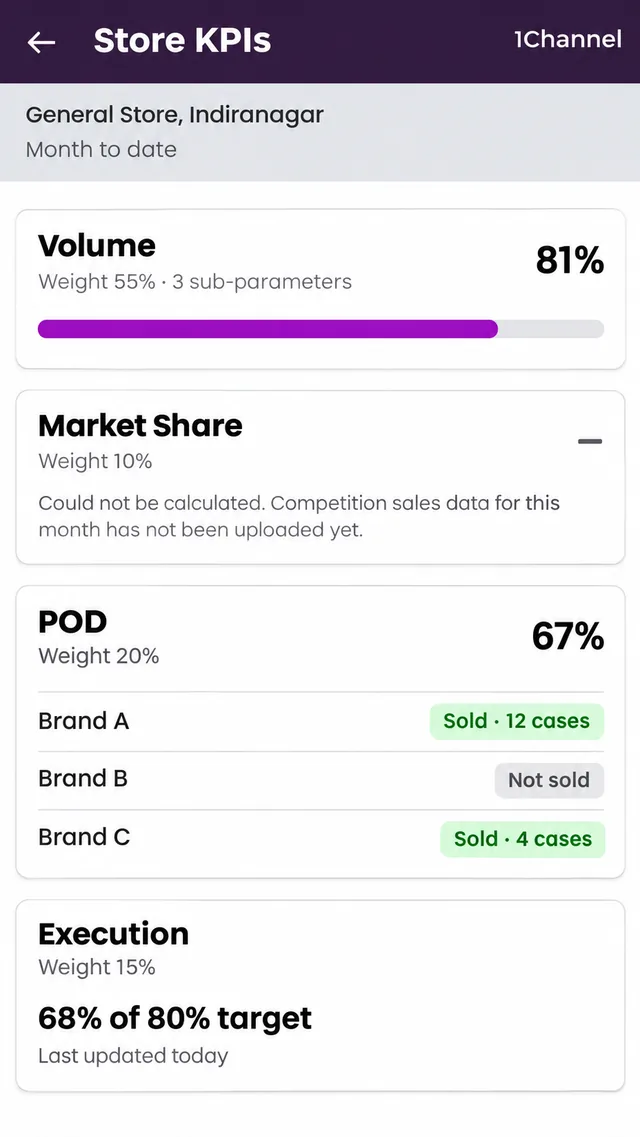
Each KPI also shows when it was last updated.
5. Score Execution Visit by Visit
Execution changes every time a rep walks in. One audit a month misses most of it.
In the same model, execution is scored on each visit and shown as an average per visit, with points for elements such as facings, eye level, adjacency and chiller purity. The outlet scorecard adds a month-to-date Perfect Store score.
6. Use the Same Model for Targets
An outlet scorecard and a rep's targets should speak the same language. The outlet view uses the same weighted model as the rep's incentive dashboard.
When both use the same weights, a rep who lifts an outlet's score also moves closer to their own target.
On the rep's home screen, a target ring shows overall achievement weighted across all KPIs, with each KPI's own percentage.
Common Mistakes
- Copying another brand's weights instead of setting your own.
- Counting market share before competitor data is in.
- Scoring execution from one audit a month.
- Judging outlets on total volume alone.
Frequently Asked Questions
1. What is an outlet scorecard?
A single weighted score for a store, built from KPIs such as volume, market share, distribution and execution, tracked month to date.
2. Can each brand choose its own KPIs and weights?
Yes. The KPIs, their weights and the slab rules are set per brand.
3. Why does market share sometimes show as blank?
It can't be calculated until that month's competitor sales data has been uploaded.
Note: Software screens may vary based on your business structure and configured workflows.