A brand's month closes on the day the last truck leaves the depot. The distributors have taken stock, the invoices are raised, the targets are signed off. What that report does not say is whether a single case reached a duka in Nairobi, a kiosk on the road out of Nakuru, or an agrovet on the outskirts of Eldoret.
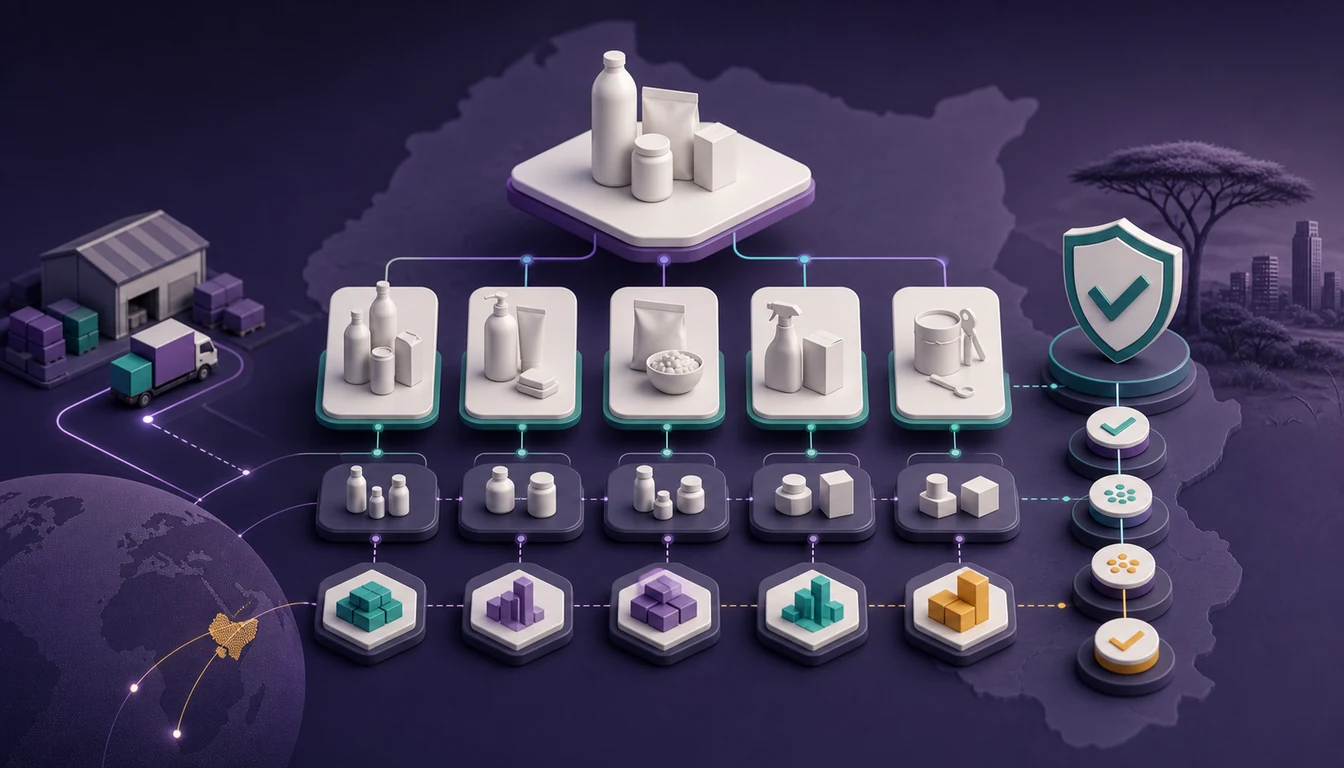
That gap has a name. Primary sales are what the brand ships to its distributors. Secondary sales are what those distributors sell onward to the outlets that actually face a shopper. The two numbers are related, but they are not the same number, and only one of them tells you anything about demand.
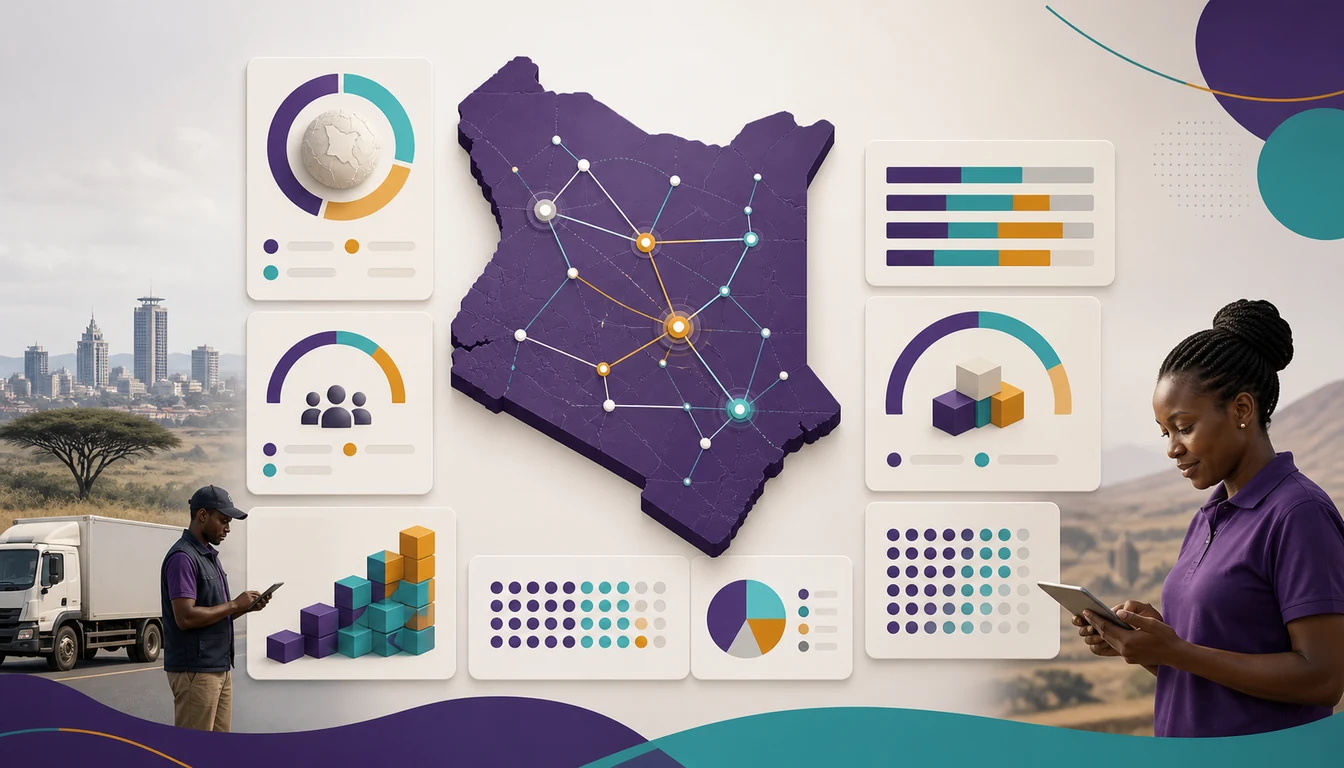
Closing the gap starts with a question that sounds administrative and turns out to be the whole exercise: which outlets does each distributor actually serve? Answer that properly and secondary sales become measurable. Leave it vague and every downstream figure — coverage, share, incentive payout, forecast — inherits the vagueness.
Primary Sales Is a Shipment, Not a Sale
Primary sales are easy to measure because they happen inside the brand's own systems. An order is placed, a truck is loaded, an invoice is raised, money is collected. The number is clean, auditable and available on the first working day of the month.
It is also a measure of how much stock a brand has pushed into the channel, not how much the channel has sold. A distributor who takes an extra load to hit a quarterly slab has generated primary sales. Nothing has been consumed. The stock is sitting in a Thika godown, ageing, and it will suppress next quarter's orders whether or not anyone models that in the forecast.
This is why brands running on primary data alone are surprised in both directions: by a stock-out in a growing territory where the distributor ordered conservatively, and by a collapse in orders from a territory that looked strong only because it was absorbing more stock than it could move.
What Secondary Sales Actually Measures
Secondary sales are the distributor's onward sales: the invoice, delivery note or van-sales receipt raised when stock leaves the distributor and goes to a duka, kiosk, mini-mart, agrovet, roadside stall, wholesaler or supermarket. It is one step closer to the shopper, and that one step changes what the data can tell you.
With secondary data you can see which outlets bought, how often, in what pack sizes, and which ones stopped buying. You can see whether a new variant is landing in the outlets it was designed for or drifting into the wrong format. You can see a territory's real velocity rather than its ordering habits.
It also anchors everything else a route-to-market programme wants to do. Coverage targets, beat plans, distributor credit limits, trade schemes and stock norms all need an outlet-level denominator. Without one you are setting targets against a channel you cannot describe.
Build the Outlet Universe Before the Mapping
The instinct is to start with the distributor's system and extract customer names. It is the wrong starting point. Distributor customer masters are built for billing, not for market understanding, and they accumulate the debris of years of billing: the same duka entered three times under three spellings, a closed shop that still holds an outstanding balance, a walk-in cash customer recorded as "cash sale".
The reliable starting point is a market-side outlet universe: the physical retail points that exist in a territory, each with a name, a format, a geo-coordinate, a contact and an owner. It is built by walking the territory, not by exporting a table. In Kenya that means capturing the formats carrying most of the volume — dukas and kiosks on residential streets, stalls inside an open-air market, agrovets in farming districts, petrol-station forecourts on the A104 — alongside modern-trade branches of chains such as Naivas, Quickmart and Carrefour.
Once outlets exist as records with coordinates, mapping them to distributors becomes an assignment problem with a checkable answer. Until then it is a negotiation between people's memories.
The Wholesaler Tier Sitting Above the Duka
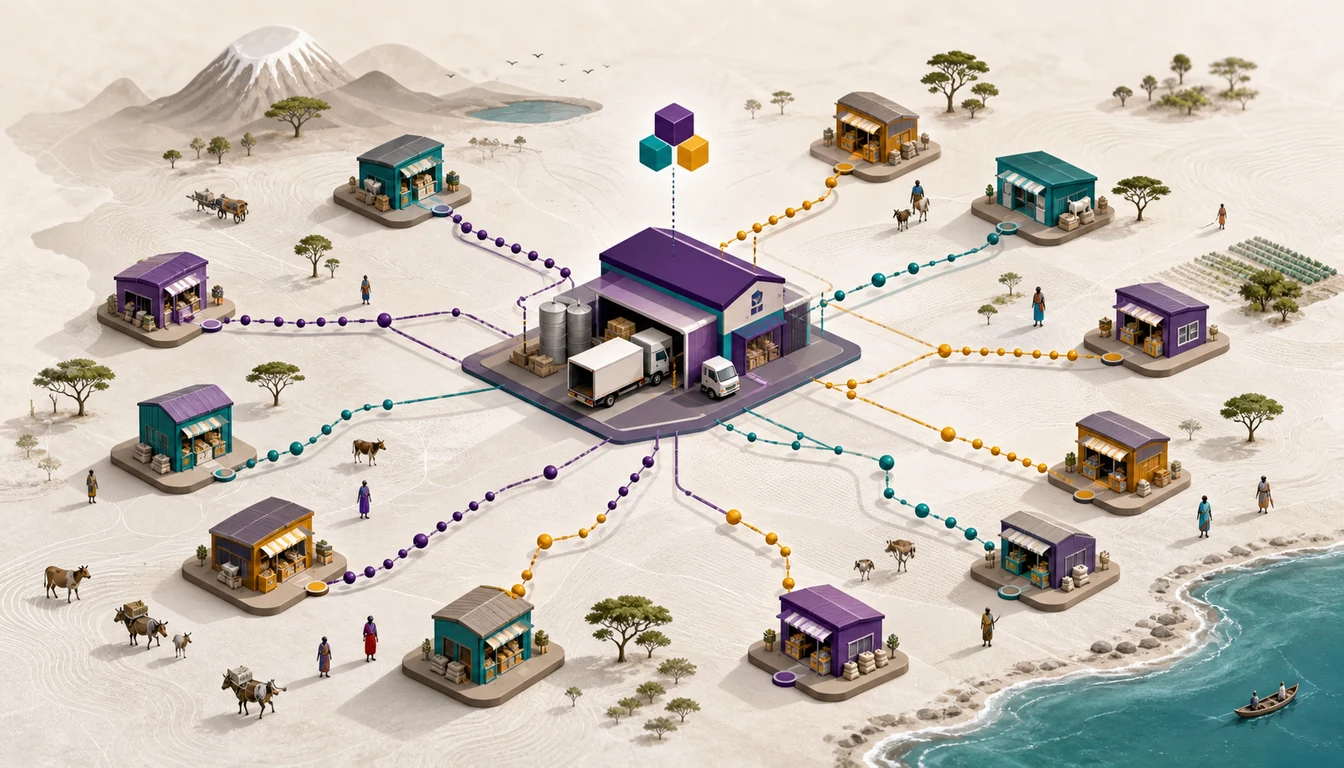
Kenya adds a layer that trips up mapping designs imported from elsewhere. A large share of dukas and kiosks do not buy from a distributor's van at all. They buy from a wholesaler in the nearest market town, and that wholesaler buys in bulk from the distributor — sometimes from more than one distributor, sometimes from a distributor in a different county.
The wholesaler is a legitimate trading partner, not a leak to be plugged. But on the distributor's invoice the wholesaler is the customer, and the fifty or eighty outlets that the wholesaler serves are invisible. If every invoice line is treated as an outlet, a single wholesaler account will masquerade as one shop with enormous throughput, and the territory's outlet count will look far smaller than the territory really is.
Most brands end up combining three responses. Classify the wholesaler explicitly as a channel type rather than a retail outlet, so its volume is never mistaken for retail offtake. Capture onward sales from cooperating wholesalers where the commercial relationship makes that realistic. And audit outlets in the catchment periodically, so you know roughly which shops the wholesale volume feeds even when you cannot see each transaction.
Mapping Distributors to the Outlets They Really Serve
Mapping is the link between a distributor record and an outlet record, and it needs to describe reality rather than intention. An outlet listed against a distributor who last delivered there eight months ago is not served by that distributor; it is a claim waiting to be tested.
A workable mapping carries a few attributes beyond the link itself: who services the outlet — the distributor's own salesperson, a van route, or a wholesaler in between; how often the route is meant to reach it; when the last verified transaction happened; and what evidence supports the link.
It also has to be many-to-many, because reality is. One outlet can genuinely be served by two distributors when they carry different portfolios from the same brand, or when one handles chilled lines and the other ambient. A model that forces one outlet to one distributor will generate false conflicts and quietly delete real trade.
Overlap, Orphans and the Claiming Problem
Two failure states show up as soon as the mapping exists, and both are informative rather than embarrassing. Overlap is where more than one distributor claims the same outlet for the same portfolio. Sometimes that is a genuine dual-servicing arrangement; sometimes it is two distributors both counting an outlet towards a coverage incentive, and the brand paying twice for one relationship. Overlap concentrates near boundaries, in market towns that draw buyers from a wide catchment, and around large wholesalers.
Orphans are the reverse: outlets that exist in the universe with no distributor mapped to them, or outlets that are visibly buying the brand's stock without any recorded servicing distributor. An orphan is usually one of three things — a genuine white space where nobody is servicing, an outlet buying through a wholesaler, or stock arriving from a neighbouring territory outside the sanctioned route.
- Overlap — resolve by evidence, then decide deliberately whether dual servicing stays or ends.
- Orphan with no supply — a coverage opportunity to be assigned to a route.
- Orphan buying via a wholesaler — map it to the wholesaler node, not to a phantom direct link.
- Orphan supplied from outside the territory — a territory-discipline issue, not a data issue.
Claiming is what turns this from a spreadsheet exercise into a governance one. Where incentives follow outlets, distributors will claim outlets. The only durable answer is that a claim must be supported by evidence — a recent invoice, a geo-verified visit at the outlet's recorded coordinates — and that unsupported claims lapse on a stated cycle rather than surviving indefinitely.
County Territories and Rules of Engagement
Kenyan territory design usually starts from county lines, because counties are how commercial teams, licensing and county-level trade administration are already organised. Sub-county and ward boundaries give a finer grain where a county is dense, and beats or routes sit underneath that as the operational unit.
County lines are a sensible administrative skeleton and a poor description of trade flows. A market town near a boundary will draw buyers from both sides of it. A corridor town on the A104 will be supplied by whoever's truck passes most conveniently. A trading centre may sit in one county while its natural wholesale source sits in the next.
Disputes are therefore normal, and should be settled by a written rule of engagement rather than by whoever escalates loudest. The rule needs to state what defines a territory — geography, outlet list, or both — who adjudicates, what evidence is admissible, and what the remedy is when a distributor supplies outside their area. Publishing it before the mapping goes live removes most of the heat from the first round of disputes.
A Morning on the Wholesale Row in Nakuru
Consider a Tuesday morning on a wholesale street in Nakuru. Pickups and handcarts are loading outside three or four bulk-breaking shops. Duka owners from the surrounding estates and from trading centres well outside town are buying cartons and half-cartons in cash and by M-Pesa, and taking them away themselves.
For the brand, every one of those movements is a secondary sale that never appears as one. The distributor's books show a handful of large invoices to the wholesalers; the dukas that actually stocked up are not customers of record. Judged on outlet count the territory looks thin, judged on volume it looks strong — both readings drawn from the same day's trade.
The fix is not to abolish the wholesale row, which does useful work getting stock to shops a van route cannot economically reach. It is to describe it accurately: classify those shops as wholesalers, record their catchment, audit the dukas around them separately, and stop counting wholesale throughput as retail coverage. Once the brand knows which volume is retail and which is bulk-breaking, both numbers become usable.
Stock That Spills Across the Border
Kenyan distribution does not stop at the Kenyan border. The Northern Corridor runs from Mombasa through Nairobi, Nakuru and Eldoret to Malaba and onward into Uganda, Rwanda, Burundi, South Sudan and eastern DRC, and traders move goods along it continuously.
For secondary sales measurement this creates a specific distortion. Stock invoiced to a western Kenya distributor and sold on to a trader may be consumed in a neighbouring EAC market. It counts as a Kenyan secondary sale in the reporting, so Kenyan share looks stronger than consumption supports, while the neighbouring market's own distributor sees demand evaporate and cannot explain why. Where price points differ across the border, the flow becomes self-reinforcing.
Reporting alone does not solve this, but it is where the pattern becomes visible: a cluster of unusually large transactions to trading accounts near a border crossing, growth that matches no change in the local retail universe, orphan volume no local outlet can account for. Brands operating on both sides of a border need their EAC markets reconciled against each other rather than reviewed separately.
Where These Programmes Go Wrong
Most secondary sales programmes fail in recognisable ways, and almost all of the failures are design choices made early.
The most common is starting from the distributor's data rather than the market. Extracting customer masters produces a mapping quickly and a wrong one permanently, because duplicates, dead accounts and cash-sale placeholders are all promoted to the status of outlets. The second is tying incentives to reported secondary sales before the data has been verified. A brand that pays on a number it cannot audit has not bought visibility; it has bought a well-formatted work of fiction, and it has taught the channel exactly what to report.
Others are quieter. Treating mapping as a one-time project, when dukas open, close and change hands continuously, so the universe decays from the day it is signed off. Ignoring the wholesaler tier and then being unable to explain the coverage numbers. Designing outlet codes no one in the field uses, so the same shop is re-entered rather than found. Running disputes informally, so the loudest relationships accumulate the best territories.
And a practical one: deploying a capture app that assumes a live connection. Rural connectivity in Kenya is uneven and mains power is not always dependable — the country had a nationwide outage in 2026 — so any tool a field team relies on must record work offline and sync later. If it does not, data is written on paper and typed in afterwards, which is where accuracy goes to die.
How 1Channel Supports Secondary Sales Mapping
1Channel's platform is built around the outlet as the unit of record. Outlets are captured in the field with geo-coordinates, format, contact and owner details, and held in a single master that field teams and distributors share rather than maintaining separate lists. Duplicate detection at capture keeps one shop from entering the universe under two names.
Distributor-to-outlet mapping is many-to-many and attribute-bearing, so an outlet can be linked to more than one distributor where that reflects reality, and each link can record its servicing mode, route frequency, last verified transaction and supporting evidence. Wholesalers can be classified as their own channel type so that bulk-breaking volume is never counted as retail coverage. Territories can be defined by county, sub-county, ward, route or beat, and outlets assigned within them.
Secondary sales are captured from distributor billing, van sales and order booking, then reconciled against primary despatches and stock on hand, so overlap, orphans and unexplained volume surface as exceptions rather than being discovered at a quarterly review. Claims and territory disputes run through a workflow with an audit trail. The mobile applications work offline and sync when a connection returns.
On invoicing, the platform supports the electronic tax invoice obligations that KRA administers through eTIMS, which apply to businesses across the trade. 1Channel is not a certifying body and makes no certification claim; the software is designed to align with those obligations and to keep the invoice trail that a distributor needs.
Key Takeaways
Secondary sales visibility is not a reporting upgrade. It is a decision to describe the market as it is, and it depends on getting the outlet universe and the distributor mapping right before anything is measured.
- Primary sales measure a shipment, secondary sales measure demand. A brand running on primary data alone is reading its own despatch discipline, not the market, and will be surprised in both directions.
- Build the outlet universe from the market, not from distributor billing data. Customer masters carry duplicates, closed shops and cash-sale placeholders that become permanent errors once promoted to outlet status.
- The wholesaler tier above the duka has to be modelled explicitly. Classify wholesalers as their own channel type, record their catchment, and never count bulk-breaking throughput as retail coverage.
- Overlap and orphans are diagnoses, not defects. Resolve claims on evidence — a recent invoice or a geo-verified visit — under a published rule of engagement, and let unsupported claims lapse on a stated cycle.
- Cross-border flow along the Northern Corridor distorts both markets it touches. Outlet-level data with coordinates makes the pattern visible, and EAC markets need reconciling against each other rather than reviewing in isolation.
None of this needs a large programme to begin. One territory, a properly walked outlet universe, an honest mapping and a written rule for disputes will tell a brand more than another quarter of despatch reports. The rest is repetition and maintenance — and the maintenance decides whether the number is still true a year from now.