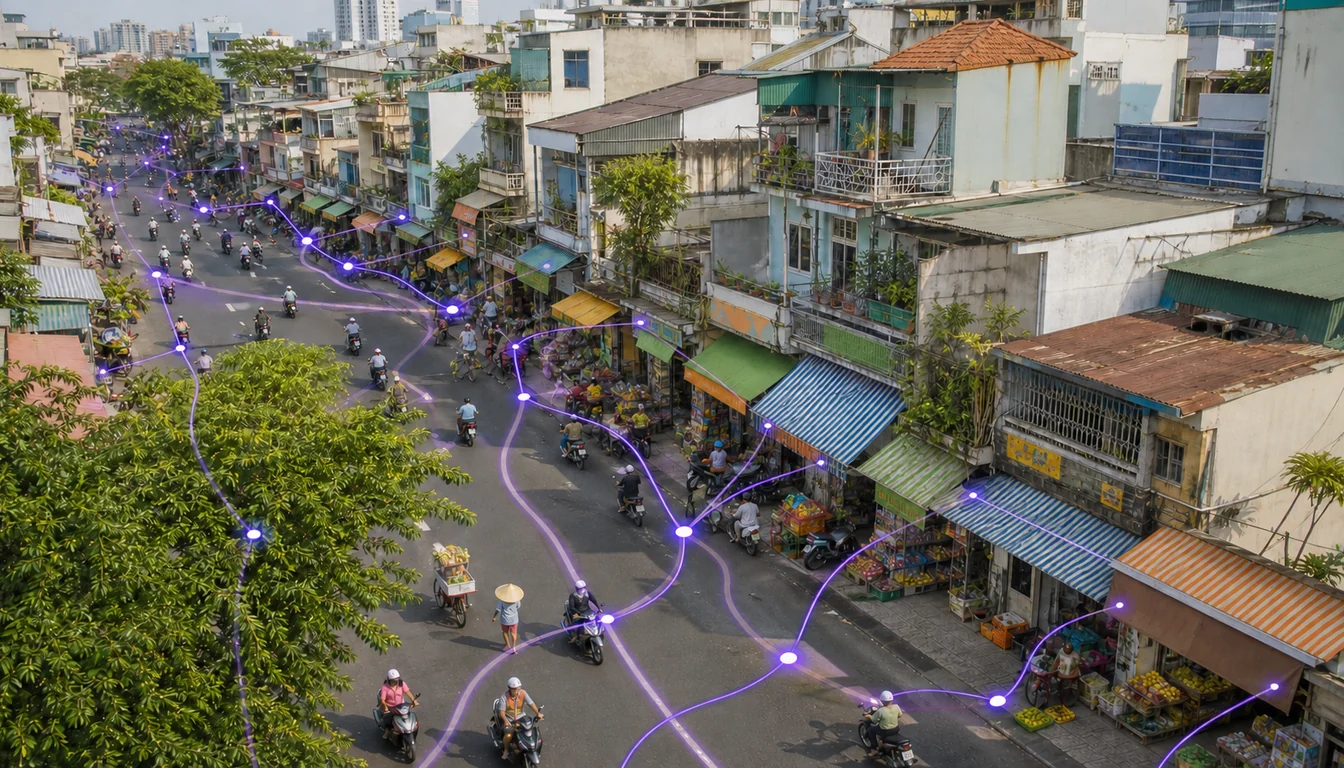
Vietnam's food and beverage outlets grew by roughly 29,300 in a year, but more shops has not meant more shops doing well.
The shift matters most for suppliers in FMCG, Agriculture, Retail and Modern Trade, and Consumer Durables that sell into cafés, kiosks and restaurants.
This post covers what the latest iPOS.vn and Nestlé Professional data shows about the first half of 2026.
It then looks at why a split outlet base changes a distributor's call plan, and how to keep coverage pointed at the outlets that are growing.
What the First-Half Data Shows
The joint report, covered by The Investor on 17 September, puts first-half 2026 F&B revenue at VND 432.7 trillion, up 6.55% year on year.
| Indicator | Latest figure |
|---|---|
| F&B outlets, Q2 2026 | 329,200 (from 299,900 a year earlier) |
| Outlets with revenue down 5% or more | 42.7% |
| Outlets growing more than 5% | 20.22% |
| Outlets reporting new budget competitors | 88.49% |
Chains Pull Ahead While the Middle Gets Squeezed
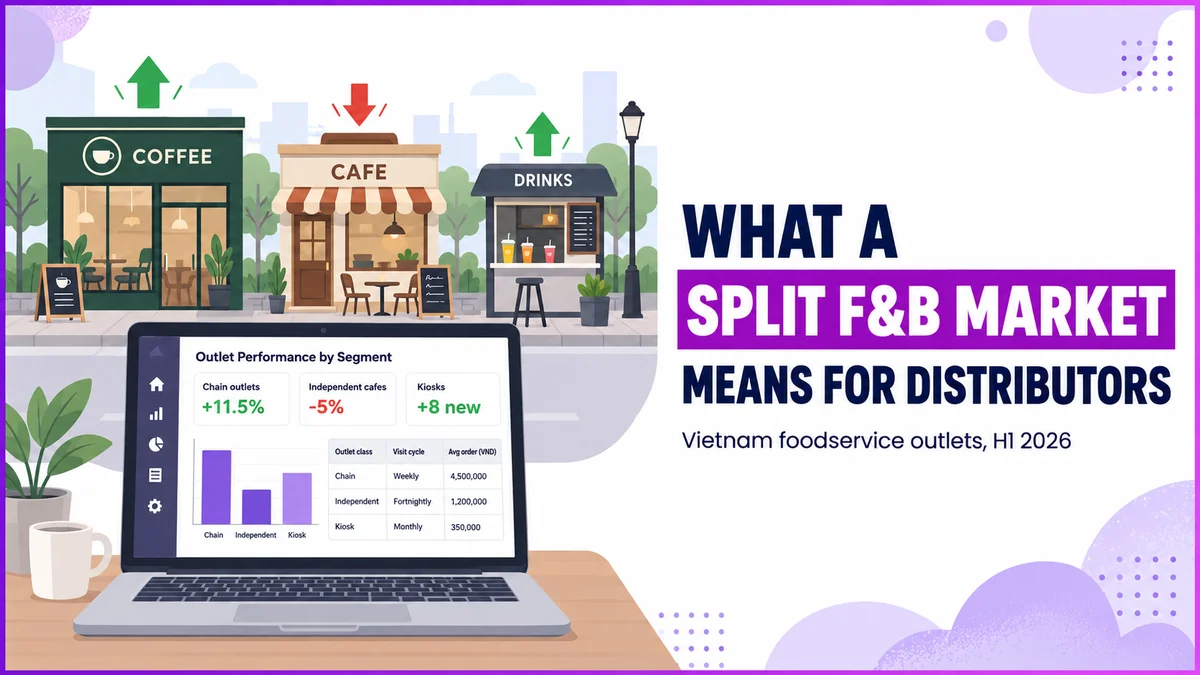
Highlands Coffee reached 1,000 outlets in June 2026, with Q2 system-wide sales up 46.7% and same-store sales up 11.5%.
Phuc Long's Q2 revenue rose 26.9% to VND 550 billion, and it plans 40 to 50 new standard stores a year.
Drinks priced at VND 36,000 to 70,000 grew from 48.29% to 61.78% of the market, while the VND 21,000 to 35,000 band shrank.
At the other end, kiosks sell items for VND 7,000 to 15,000. Mid-market independents can match neither the price nor the premium experience.
Why This Changes the Distributor's Call Plan
For a distributor supplying coffee, dairy, syrups or packaging, total outlet count is now a misleading number on its own.
A growing chain outlet and a struggling independent café can sit on the same route, yet their order trends and credit risk are moving apart.
| Outlet group | What the data suggests | What the call plan can do |
|---|---|---|
| Chain outlets | Double-digit sales growth | Hold visit frequency and protect listings |
| Mid-market independents | Pressure from both sides | Watch order trends and credit exposure |
| Low-price kiosks | Rising competition, small tickets | Serve on efficient, denser routes |
| New openings | About 29,300 net additions | Onboard fast, confirm trading status later |
How 1Channel Keeps Coverage on Growing Outlets
1Channel's cloud outlet master types every store by channel and format, so each outlet class carries its own visit cycle.
Outlet performance ranking and planned-versus-actual visits show which accounts are gaining ground, and closures or ownership changes are logged against the existing record.
Automated route plans are then built from that master, so a rep's week follows where orders are actually growing.
Put Every Call Where the Growth Is
Classify chain outlets, independents and kiosks once, give each class its own cadence, and rank stores by performance from one cloud platform built for distributors in Vietnam.
Explore Outlet Management →Key Takeaways
- Growth is uneven. Revenue rose 6.55%, yet 42.7% of surveyed outlets saw sales fall by 5% or more.
- Chains and kiosks gain. Premium chains grow fast while low-price kiosks add competition from below.
- Outlet count misleads. Around 29,300 net new outlets say little about which accounts will order more.
- Segment the call plan. Visit cycles, credit checks and route density should follow each outlet's real trend.
Source: The Investor