In field sales, speed is everything. Delayed visibility into visits, sales progress, beat performance, or store-level gaps can directly impact order collection and revenue recovery.
This is where real-time dashboards inside a Sales Force Automation (SFA) system become critical.
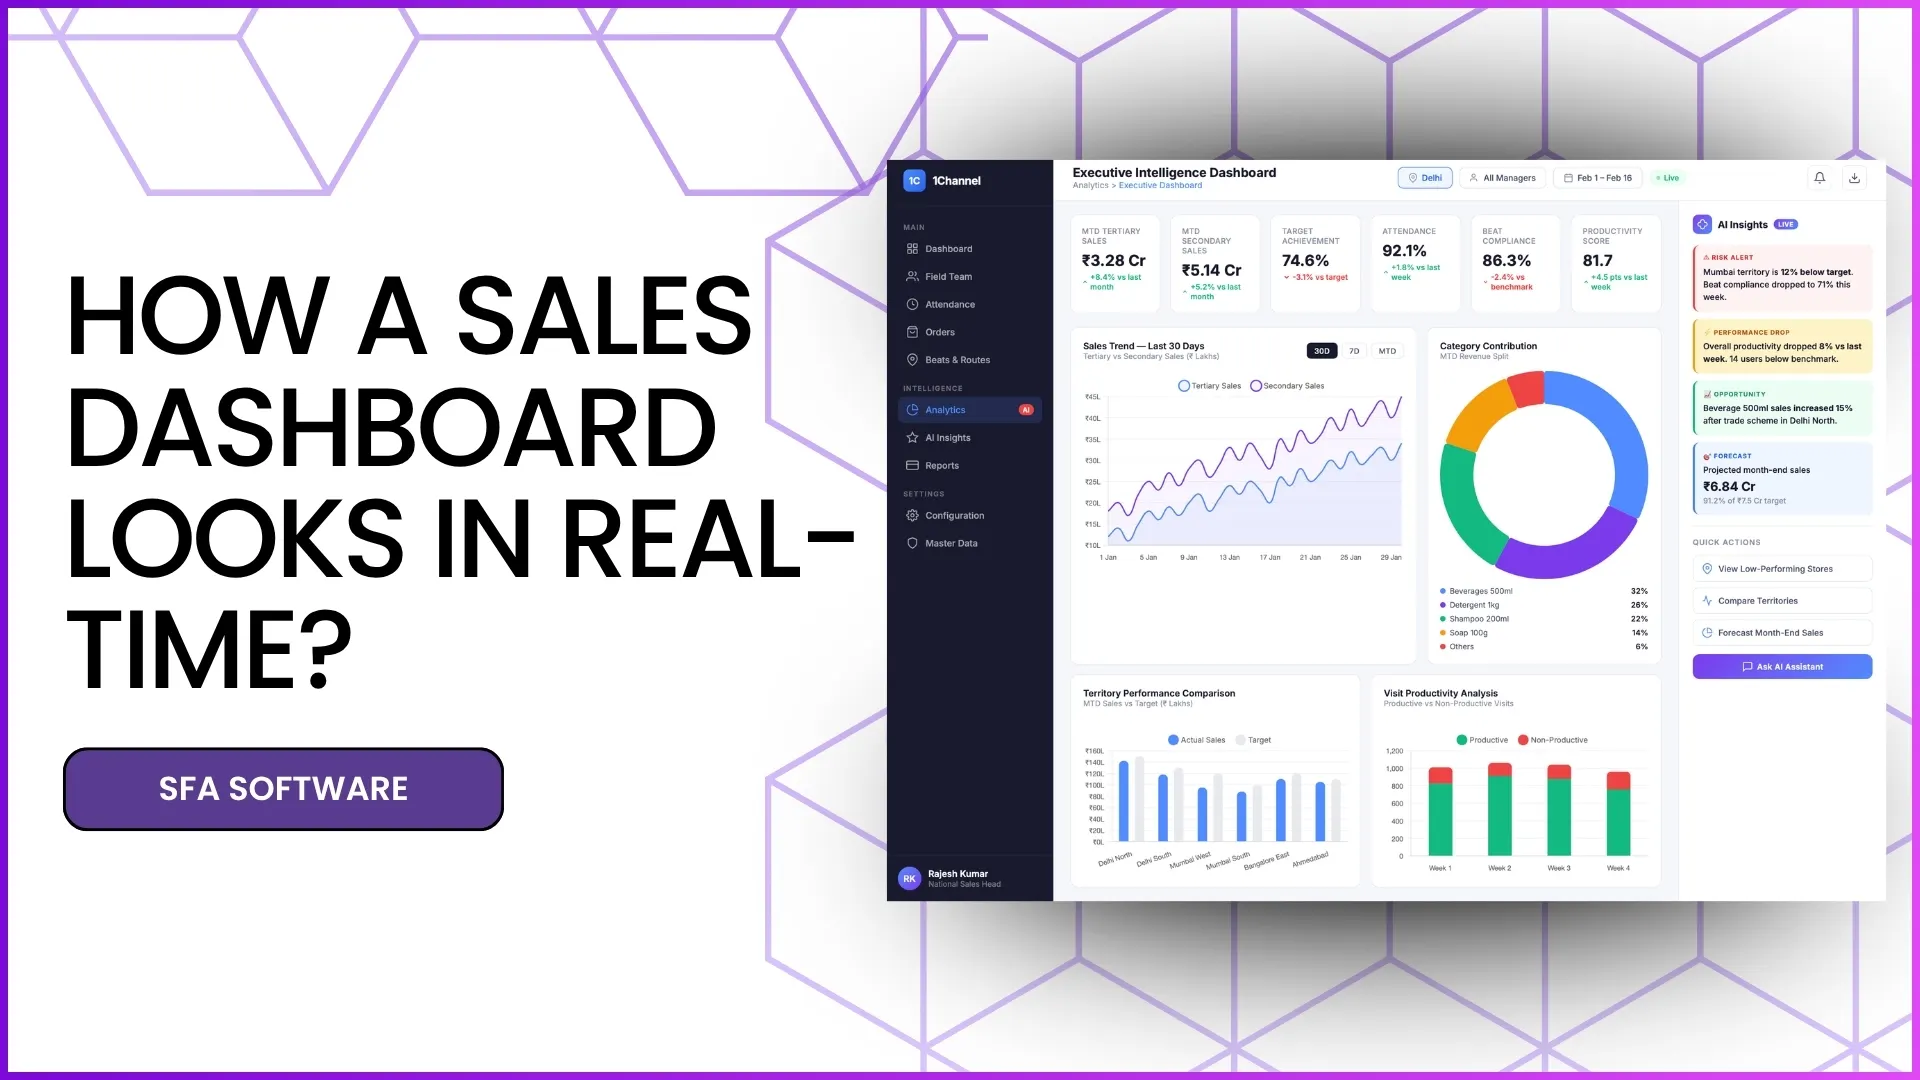
Instead of waiting for end-of-day reports, managers and field teams can access live sales movement, visit productivity, territory progress, and performance alerts from a centralized dashboard.
The advanced dashboard and analytics layer of the SFA portal acts as a live operational control center, helping teams make faster decisions and recover missed opportunities during the day itself.
As mentioned in the uploaded SFA document, dashboard configurations and analytics views can be customized as per business requirements, making them highly useful for field-driven operations.
Why Real-Time Dashboards Matter for Faster Order Collection
For field sales teams, order collection depends heavily on three things:
- store visit execution
- beat compliance
- live sales visibility
When these insights are available in real time, teams can quickly identify:
- which stores are not yet covered
- which territories are underperforming
- where sales conversion is dropping
- which beats need immediate attention
- where follow-up visits are required
This directly reduces response time and helps recover pending orders before the sales day ends.
The uploaded document also highlights dedicated reports such as Beat Compliance Report, Visit Productivity Report, Sales Productivity Report, and Store Visit Report, all of which support faster order collection workflows.
Explore Sales Analytics Software
Transform your sales operations with real-time dashboards, advanced analytics, and actionable insights designed for field sales teams.
Learn More About Sales Analytics →Executive Analytics Dashboard
The Live Command Center for Sales Managers
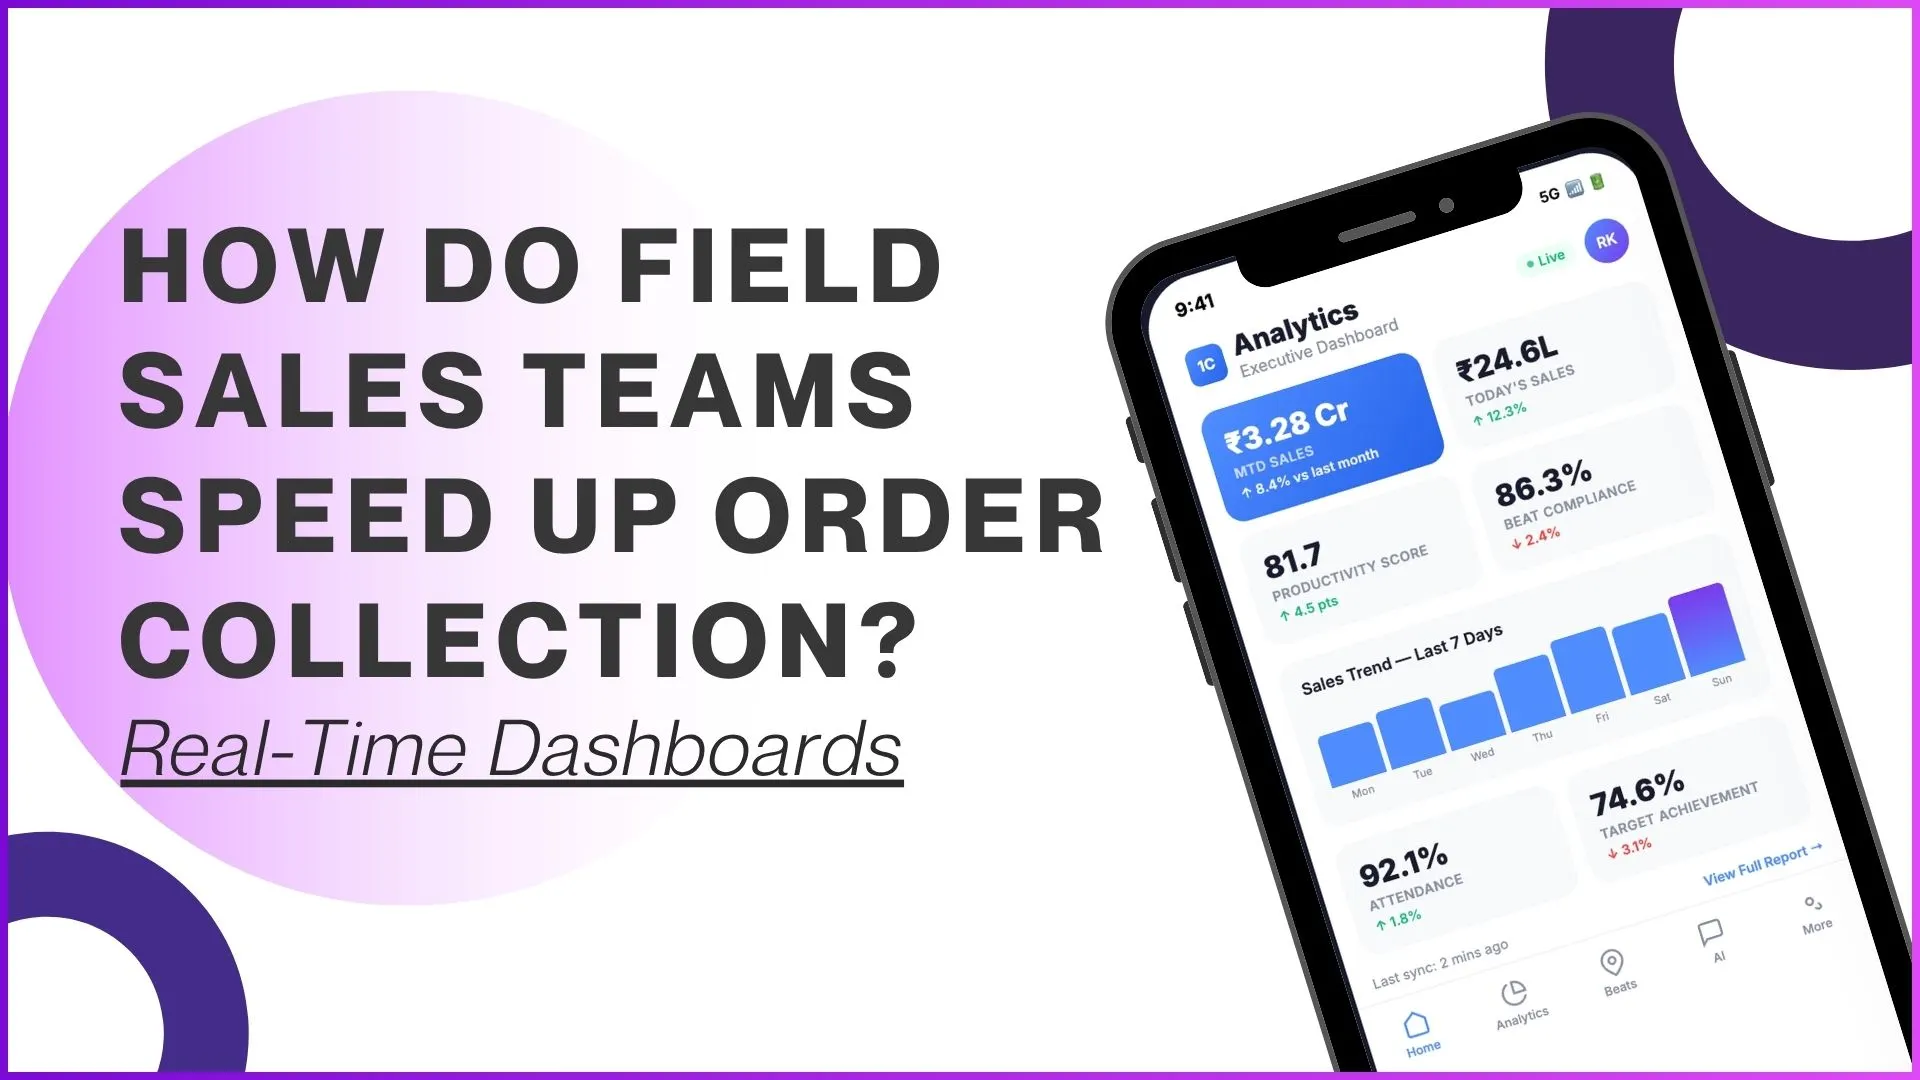
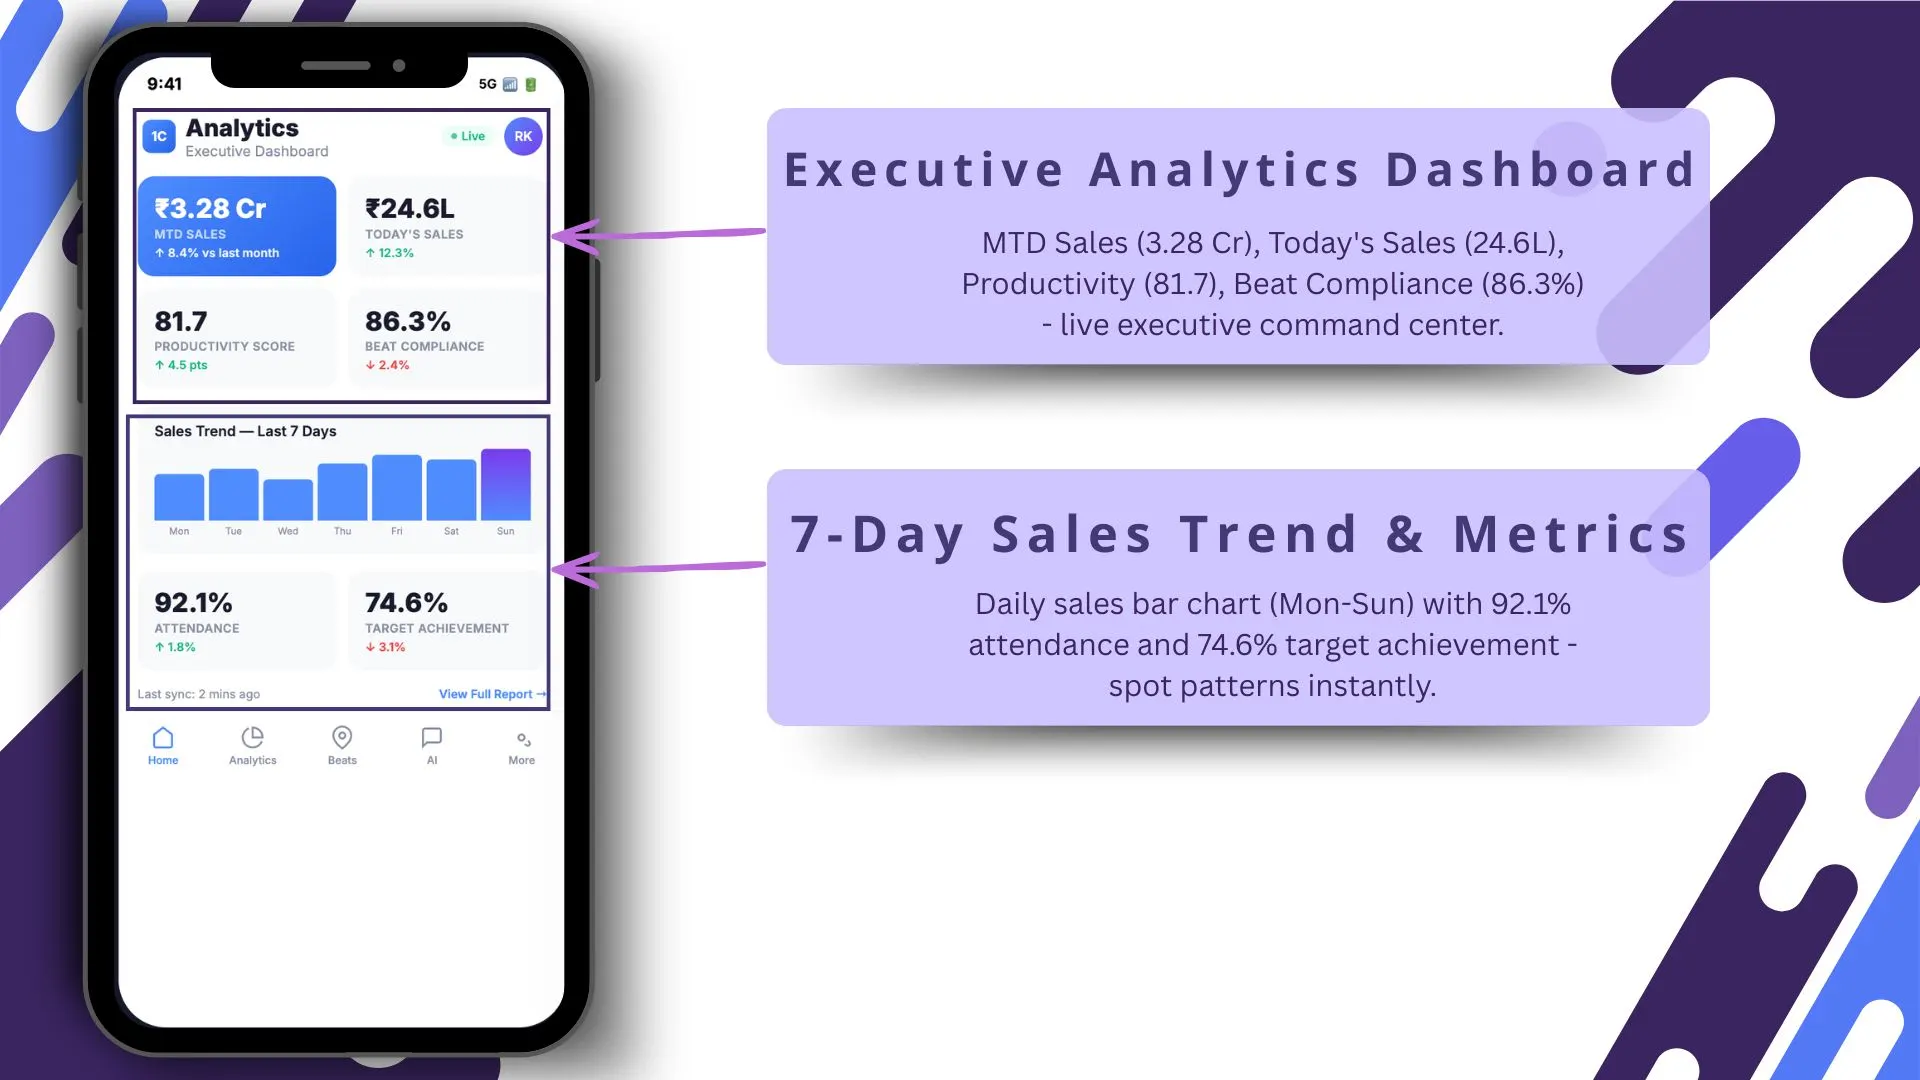
The Executive Analytics Dashboard works as the first decision-making screen for managers and admin users.
Key screen metrics
- MTD Sales: 3.28 Cr
- Today's Sales: 24.6L
- Productivity: 81.7
- Beat Compliance: 86.3%
This dashboard functions as a live command center where leadership teams can instantly monitor daily sales progress and field execution.
Managers can immediately check:
- whether daily targets are on track
- how productive the field force is
- whether beat plans are being followed
- if any sales territory needs intervention
Because the advanced dashboard is built on analytics-driven data, it enables faster decision-making without waiting for manual reporting.
7-Day Sales Trend & Metrics
Improve Visit Timing with Daily Performance Patterns
The weekly trend screen helps teams analyze order movement patterns across the week.
Included screen points
- daily sales bar chart (Mon–Sun)
- 92.1% attendance
- 74.6% target achievement
This is highly useful for identifying:
- high-performing sales days
- low-conversion days
- attendance-driven sales dips
- best visit windows for certain beats
For example, if Tuesday and Wednesday consistently show stronger order volumes, managers can optimize beat plans and store routing accordingly.
This aligns directly with the system's productivity and attendance reporting capabilities available in analytics reports.
Territory Snapshot
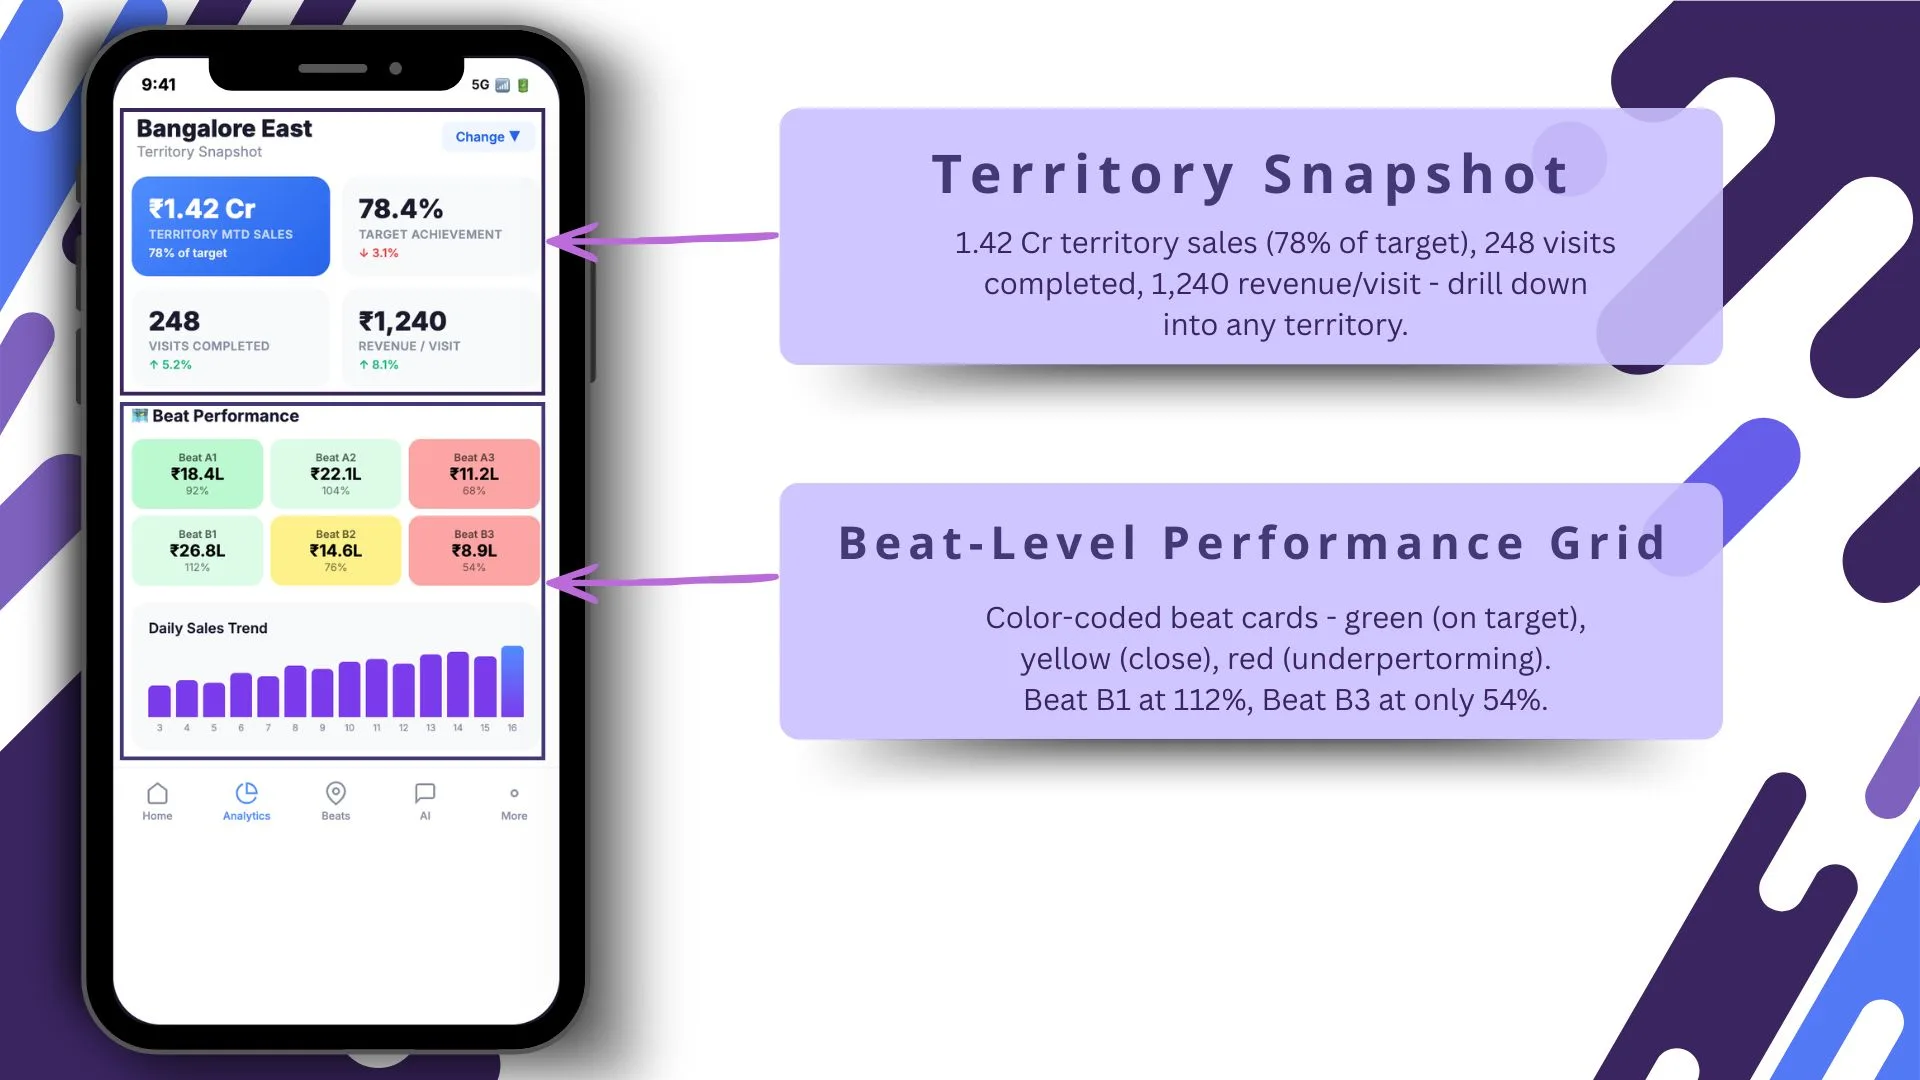
Faster Territory-Level Order Recovery
The territory snapshot gives managers a granular view of field performance.
Screen metrics
- 1.42 Cr territory sales
- 78% of target
- 248 visits completed
- ₹1,240 revenue per visit
This helps teams understand how efficiently each territory is converting visits into orders.
Key benefits include:
- identifying low-conversion territories
- comparing sales vs visit volume
- reallocating field reps quickly
- recovering missed stores
The uploaded document strongly supports this through territory, visit productivity, and sales productivity reporting layers.
Beat-Level Performance Grid
Spot Weak Beats Instantly
Beat performance is one of the most critical levers in field sales execution.
Color-coded beat grid
- Green = on target
- Yellow = close
- Red = underperforming
Example
- Beat B1 = 112%
- Beat B3 = 54%
This visual grid helps managers instantly prioritize underperforming routes.
Instead of reviewing lengthy reports, they can directly assign corrective actions such as:
- additional store visits
- priority follow-ups
- distributor stock checks
- target-based coaching
This directly aligns with the Beat Compliance Report and market visit planning modules described in the uploaded document.
AI Assistant – Chat Interface
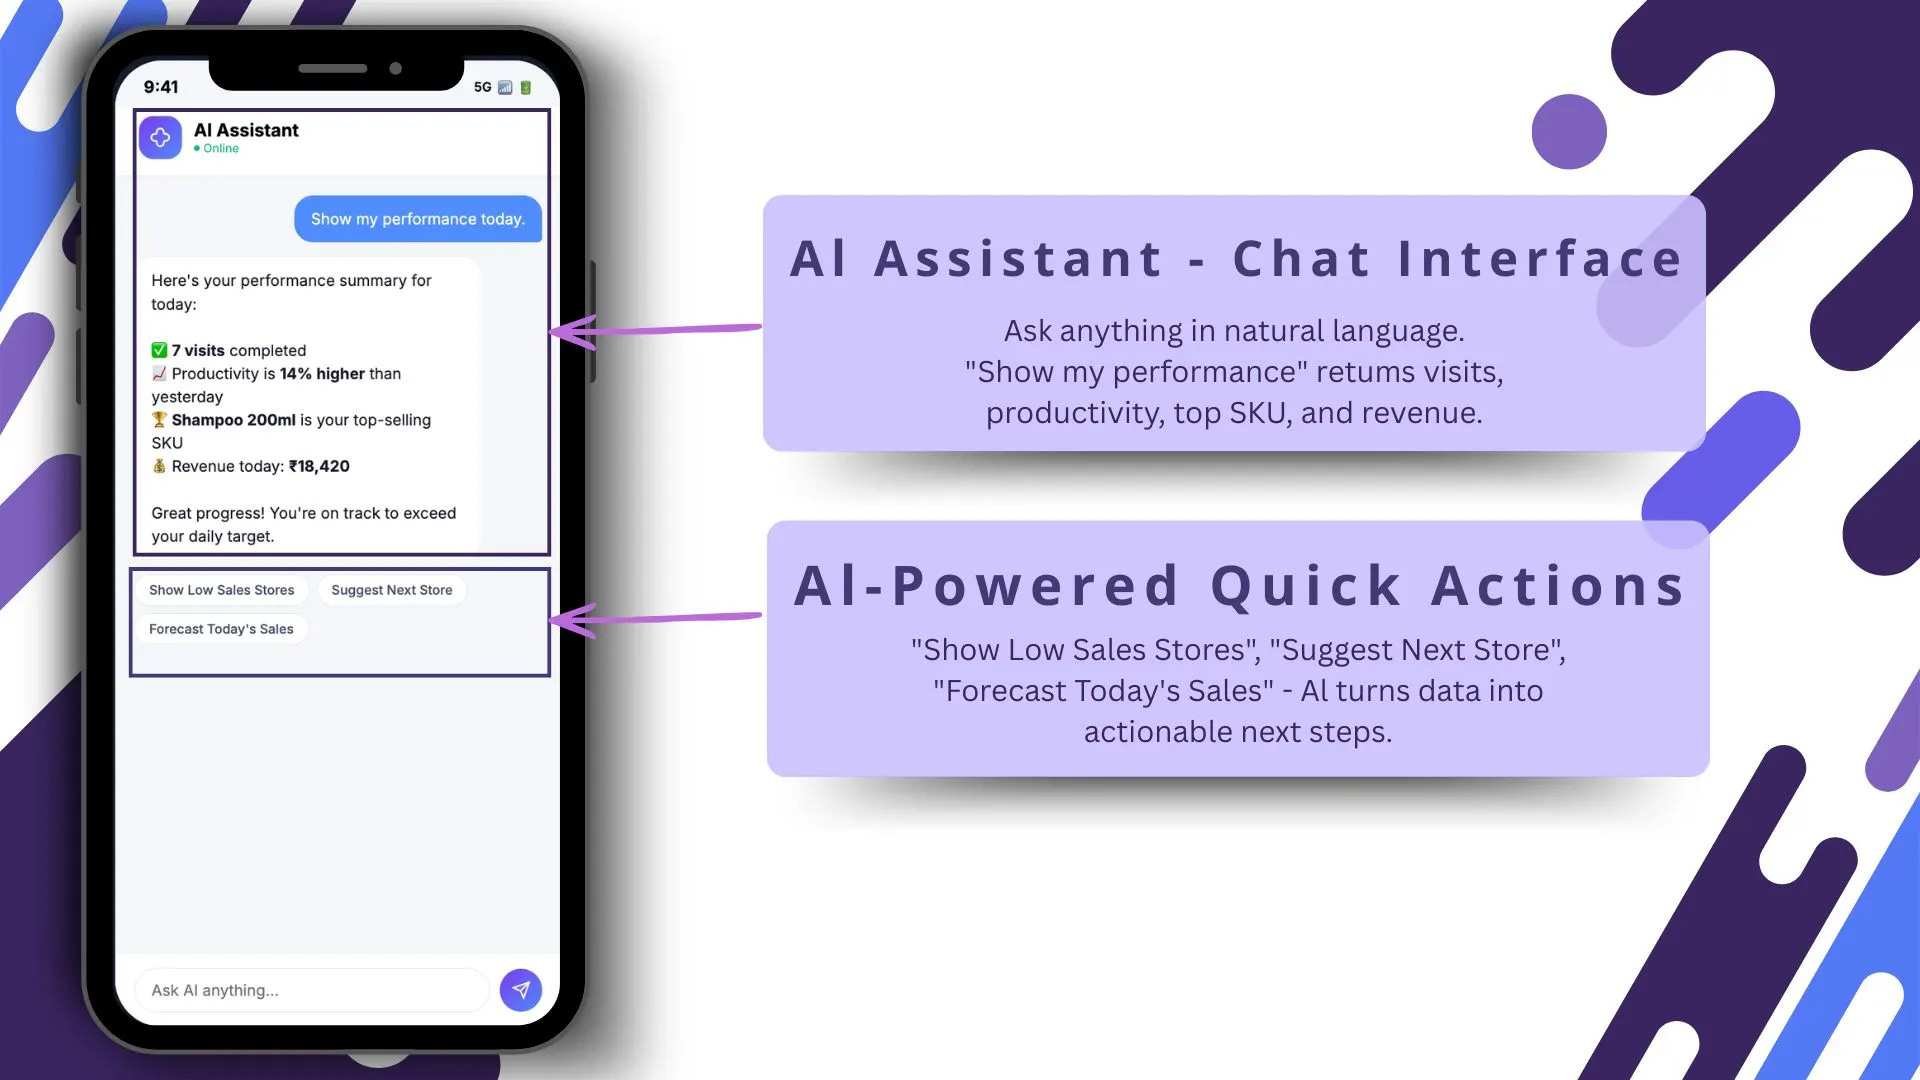
Faster Decisions Through Natural Language Insights
A conversational AI layer makes dashboard insights easier to access.
Example query
"Show my performance"
Response includes
- visits completed
- productivity
- top SKU
- revenue
This reduces dependency on manual navigation through multiple dashboard tabs.
Instead of opening separate reports, field managers and team leaders can instantly fetch critical performance metrics through simple natural language queries.
This complements the analytics and reporting architecture already present in the SFA portal.
AI-Powered Quick Actions
Faster Field Execution from the Dashboard
Quick actions help both managers and field reps move from insight to action immediately.
Included actions
- Show Low Sales Stores
- Suggest Next Store
- Forecast Today's Sales
These actions help teams:
- prioritize pending outlets
- recover low-sales stores
- optimize visit sequence
- improve end-of-day order closure
This directly supports faster order collection by minimizing decision lag.
Smart Alerts – AI Nudges
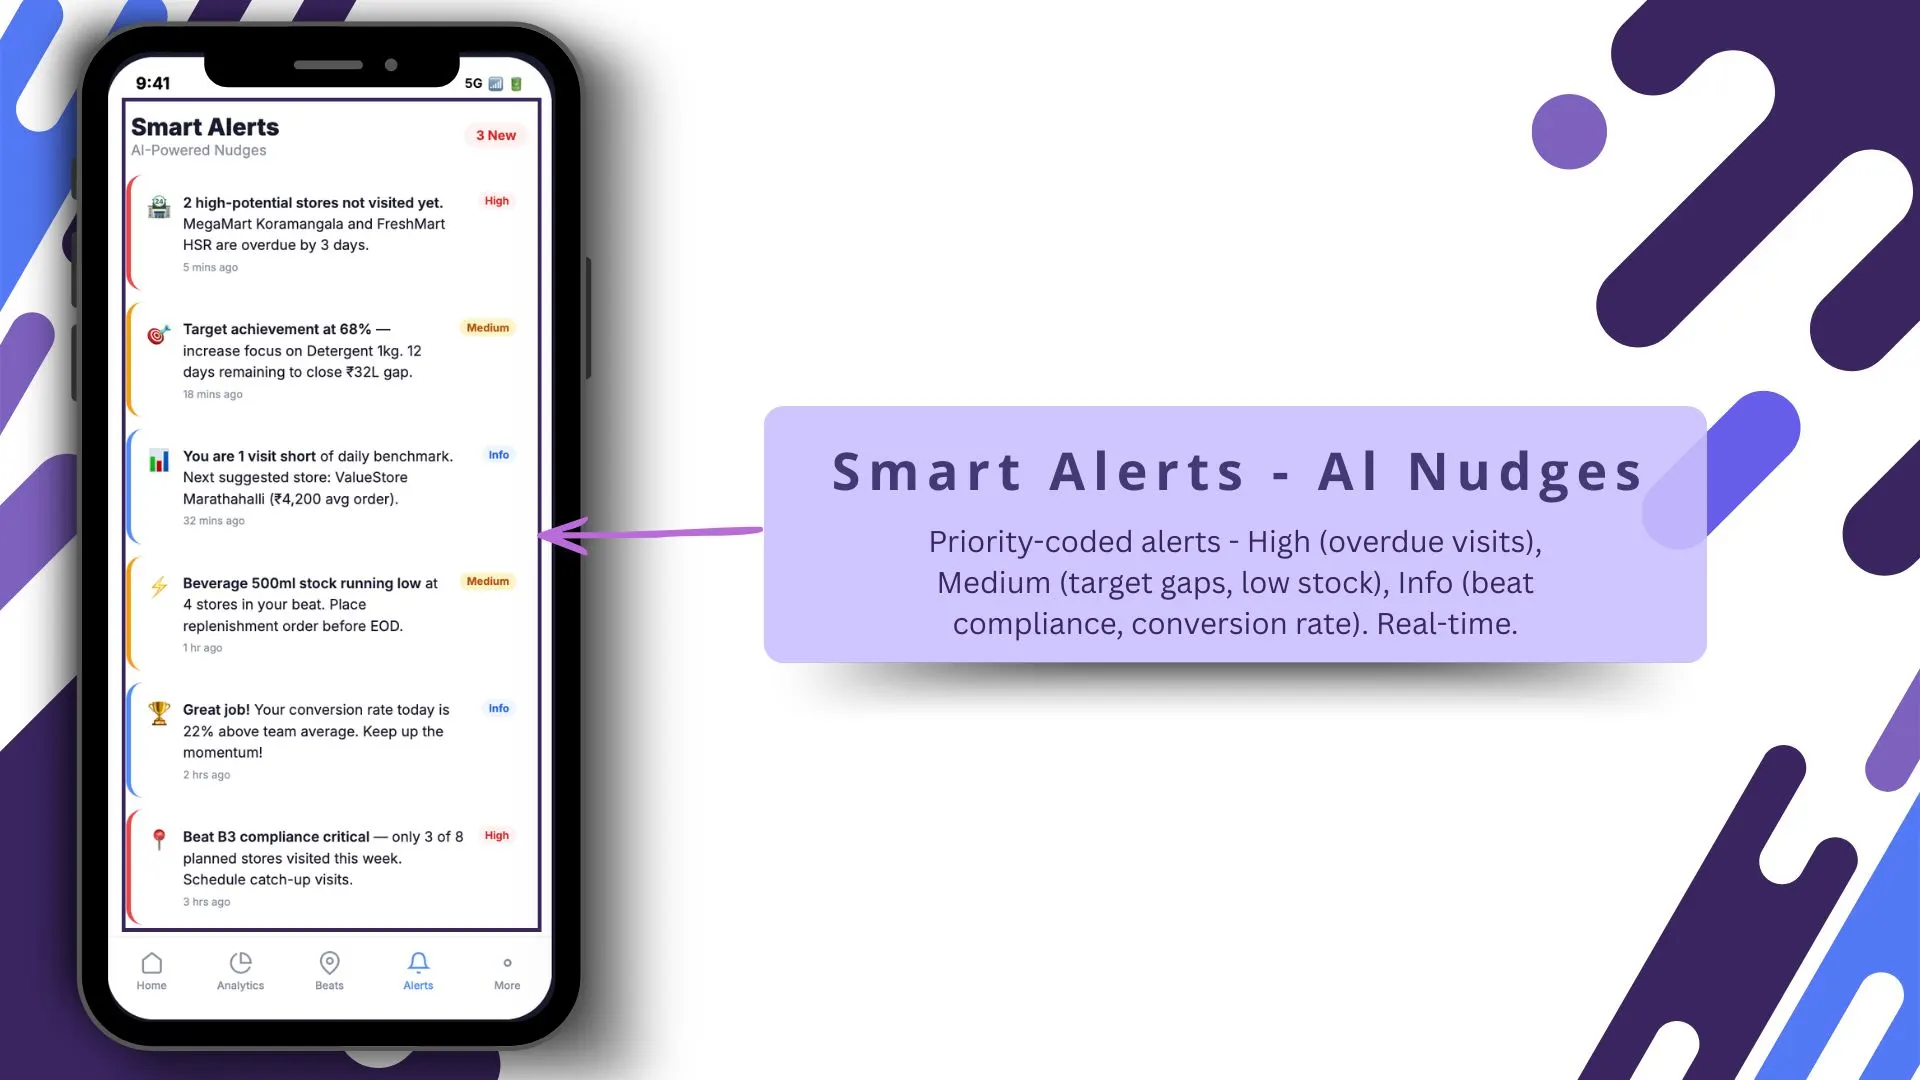
Prevent Missed Orders in Real Time
Real-time alerts help teams proactively fix execution gaps.
Alert levels
- High: overdue visits
- Medium: target gaps / low stock
- Info: beat compliance / conversion
This is especially important for store recovery and missed order prevention.
For example:
- a delayed visit alert can trigger immediate follow-up
- low stock alerts can push replenishment orders faster
- target gap alerts help re-prioritize the sales route
This aligns well with visit reports, stock reports, and activity tracking in the SFA document.
Automated Report Delivery
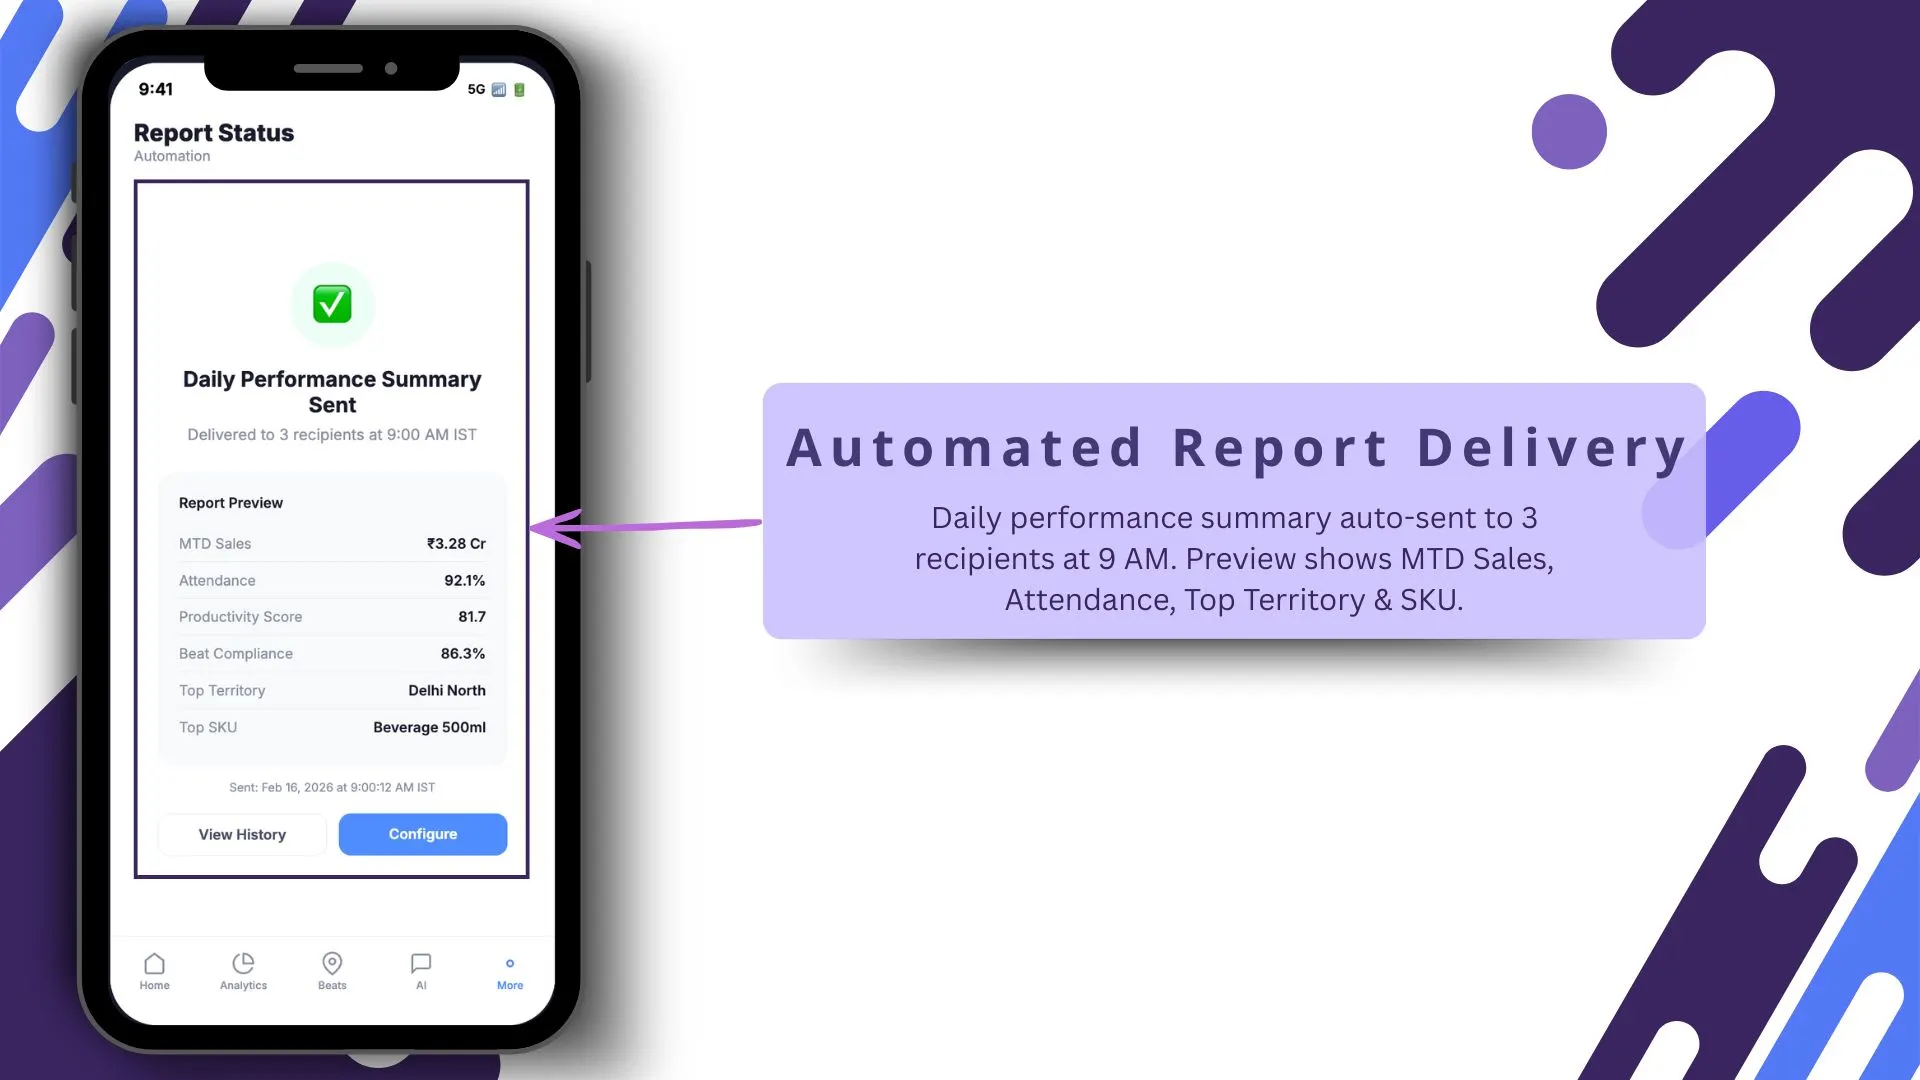
Keep Leadership Aligned Without Manual Follow-Ups
Automated daily reports ensure that leadership teams stay aligned on field performance.
Example
Daily performance report auto-shared at 9 AM
This helps:
- sales heads review performance early
- regional managers plan interventions
- leadership track revenue progress
- improve accountability
The document also highlights downloadable and scheduled reports across multiple sales and field activities.
(Note: Software screens may vary based on your business structure and configured workflows.)
Why Choose 1Channel SFA for Field Sales Visibility
1Channel SFA helps businesses bring complete field sales visibility into a single real-time dashboard environment.
From advanced analytics dashboards and beat compliance tracking to visit productivity, territory performance, stock visibility, and automated reporting, the platform enables faster order collection decisions across teams.
With configurable dashboards, reporting layers, and workflow controls, it helps managers reduce response time and improve sales execution at scale.
Transform Field Sales with Sales Force Automation
1Channel Sales Force Automation provides comprehensive real-time dashboards, analytics, and reporting to help your field teams speed up order collection, improve beat compliance, and maximize territory performance.
Explore Sales Force Automation →Conclusion
Real-time dashboards help field sales teams move from reactive reporting to proactive order recovery.
By combining live sales data, beat-level insights, territory performance, alerts, and AI-driven actions, teams can speed up decision-making and improve order collection throughout the day.
Instead of waiting for reports after market hours, managers can act instantly and ensure better coverage, higher conversion, and stronger sales productivity.
FAQs
How do real-time dashboards improve field sales order collection?
They provide instant visibility into sales, beat compliance, store visits, and territory performance, helping teams recover missed orders faster.
What dashboard metrics are most useful for managers?
Key metrics include MTD sales, today's sales, productivity, beat compliance, target achievement, and visit conversion.
How does beat-level visibility help sales teams?
It helps identify weak routes quickly so teams can prioritize underperforming beats and improve store coverage.
Can managers track visit productivity in real time?
Yes, the system supports visit productivity and detailed visit reporting for live performance monitoring.
How do automated reports support leadership teams?
They ensure daily alignment by automatically sharing performance insights without manual follow-up.